
Goldman Sachs (GS.US) kicked off earnings season by joining other major banks in reporting their Q2 2025 results. Similar to other large U.S. banks with a significant investment banking presence, Goldman Sachs reported strong revenues, driven by a rebound in financial markets after April's sell-offs.
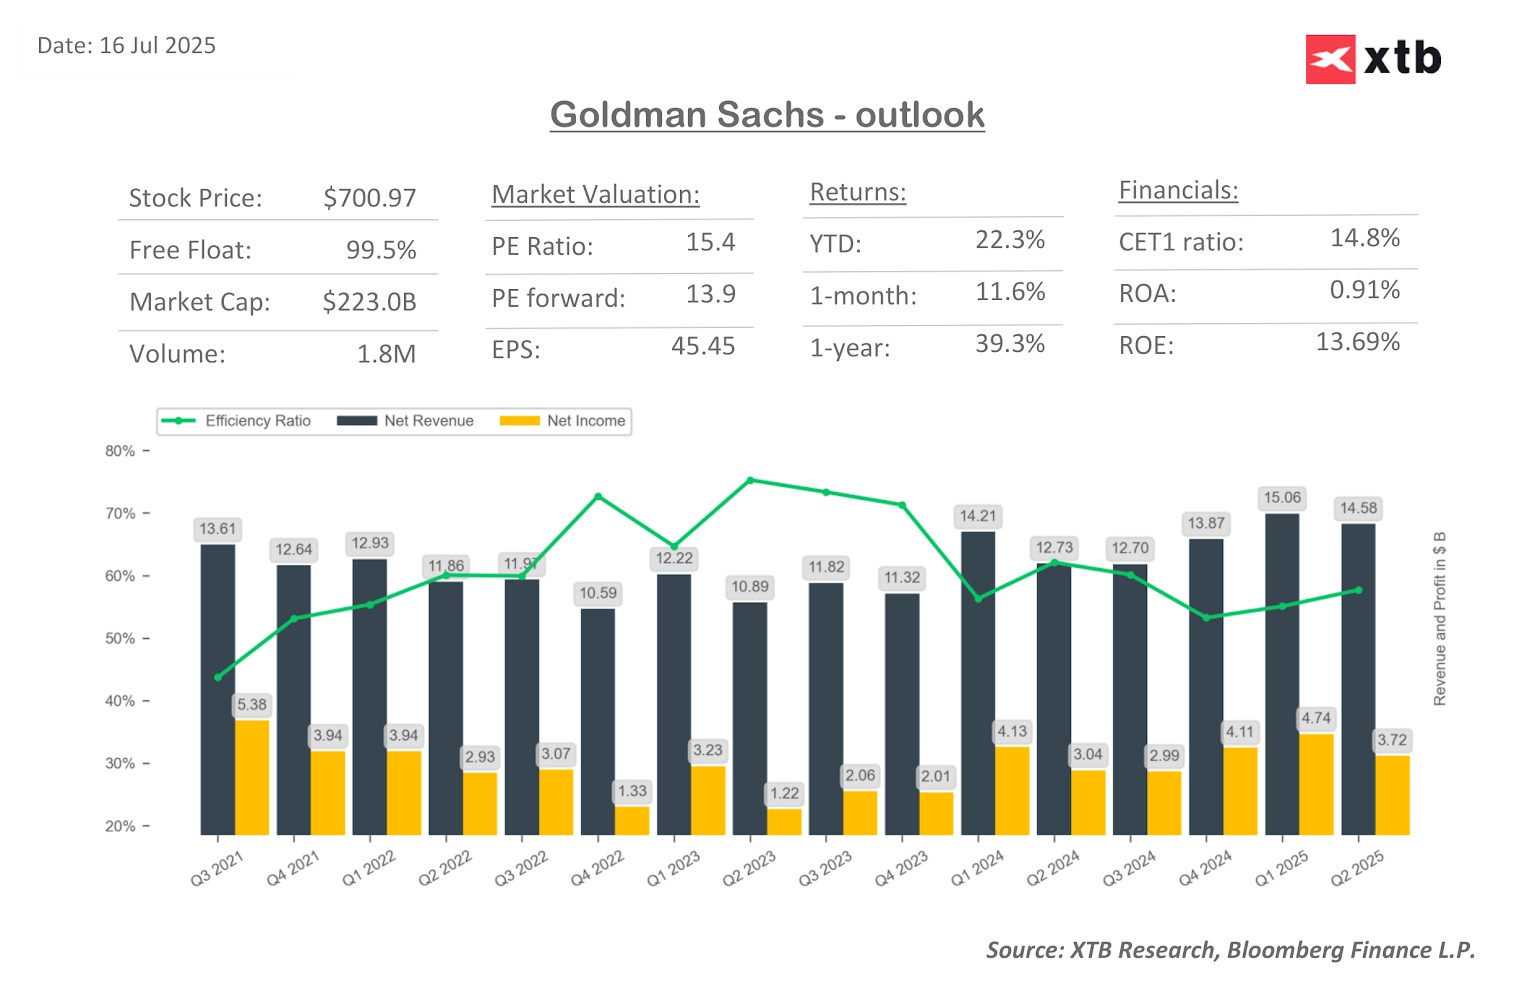
The company reported net revenues of $14.58 billion, a 15% increase year-over-year. Although this figure is lower than the previous quarter, it significantly surpassed estimates of $13.53 billion. The equities trading revenue segment showed the strongest momentum, rising by 23% year-over-year to $4.3 billion. This marks the best result in the company's history for this segment, largely driven by a 45% year-over-year increase in brokerage revenues.
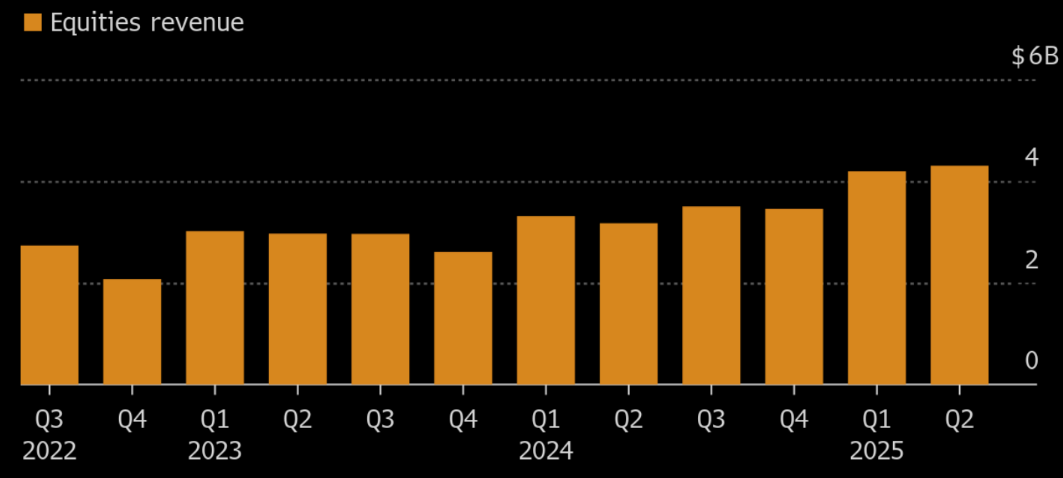
Goldman Sachs' equities trading revenue. Source: Bloomberg Finance L.P.
The company also achieved better-than-expected cost efficiency, reflected in a lower efficiency ratio (the percentage of costs to revenues) of 63.4%, compared to forecasts of 64.8%. This contributed to a higher net earnings per share (EPS) of $10.91, compared to $8.62 a year earlier.
Despite solid results, Goldman Sachs (similar to JP Morgan Chase) is trading down about -0.5% today. The market's reaction to the results remains neutral, with the prospect of strengthening earnings trends likely to offer long-term potential for the bank's growth rather than a short-term rebound.
Q2 2025 Results:
Revenues:
-
Net Revenue: $14.58 billion (+15% y/y); estimates: $13.53 billion
-
FICC Sales & Trading Revenue: $3.47 billion; estimates: $3.26 billion
-
Equities Sales & Trading Revenue: $4.30 billion; estimates: $3.72 billion
-
Global Banking & Markets Net Revenues: $10.12 billion (+24% y/y); estimates: $9.03 billion
-
Investment Banking Revenue: $2.19 billion (+27% y/y); estimates: $1.8 billion
-
Advisory Revenue: $1.17 billion (+71% y/y); estimates: $852.7 million
-
Equity Underwriting Revenue: $428 million (+1.2% y/y); estimates: $384.8 million
-
Debt Underwriting Revenue: $589 million (-5.3% y/y); estimates: $592.5 million
-
Net Interest Income: $3.10 billion; estimates: $2.43 billion
Earnings & Profitability Ratios:
-
EPS: $10.91 (vs. $8.62 y/y)
-
Adj. EPS: $10.91; estimates: $9.77
-
ROE (Return on Equity): +12.8%; estimates: +11.3%
-
Efficiency Ratio: 63.4%; estimates: 64.8%
Costs & Losses:
-
Platform Solutions Pretax Loss: $57 million; estimates: $85.6 million loss
-
Provision for Credit Losses: $384 million (+36% y/y)
-
Total Operating Expenses: $9.24 billion (+8.3% y/y)
Balance Sheet:
-
Total Deposits: $466 billion (-1.1% q/q)
-
Standardized CET1 Ratio: 14.5%; estimates: 14.7%
-
Book Value Per Share: $349.74 (vs. $327.13 y/y)
-
Assets Under Management: $3.29 trillion (+12% y/y)
-
Total AUS Net Inflows: $5 billion (-93% y/y)
-
Loans: $217 billion; estimates: $211.09 billion

Daily Summary: Equities Diverge as Tech Lags, Europe Rallies on Earnings & PMIs (24.07.2026)

US OPEN: Nasdaq hits 1-month low! Geopolitics bring AI trade down!

Market Wrap: European Stocks Are Trying to Rebound as the Week Comes to an End💡

Alphabet shares are down 22% from their all-time high 🚩 Is Google ready to resume its bull run?
This content has been created by XTB S.A. This service is provided by XTB S.A., with its registered office in Warsaw, at Prosta 67, 00-838 Warsaw, Poland, entered in the register of entrepreneurs of the National Court Register (Krajowy Rejestr Sądowy) conducted by District Court for the Capital City of Warsaw, XII Commercial Division of the National Court Register under KRS number 0000217580, REGON number 015803782 and Tax Identification Number (NIP) 527-24-43-955, with the fully paid up share capital in the amount of PLN 5.869.181,75. XTB S.A. conducts brokerage activities on the basis of the license granted by Polish Securities and Exchange Commission on 8th November 2005 No. DDM-M-4021-57-1/2005 and is supervised by Polish Supervision Authority.