
Looking technically at the NZDUSD chart on the H4 interval, a head and shoulders formation has formed. Currently, the price is testing the neckline of the said formation (purple line on the chart below), and if this line is broken, the discount could take a turn for the worse. According to classical technical analysis assumptions, this will be an excuse to change the trend to a downtrend. The downward scenario is also supported by the Overbalance methodology. Last week, the price rebounded from the upper limit of the 1:1 system (red rectangle), which confirms the bearish sentiment. If such a scenario is successful, the levels of 0.6000, and 0.5900 should be considered as the closest supports, the former stemming from the 61.8% Fibonacci measure of the last upward wave and previous price reactions, and the latter from the Fibo ratio itself.
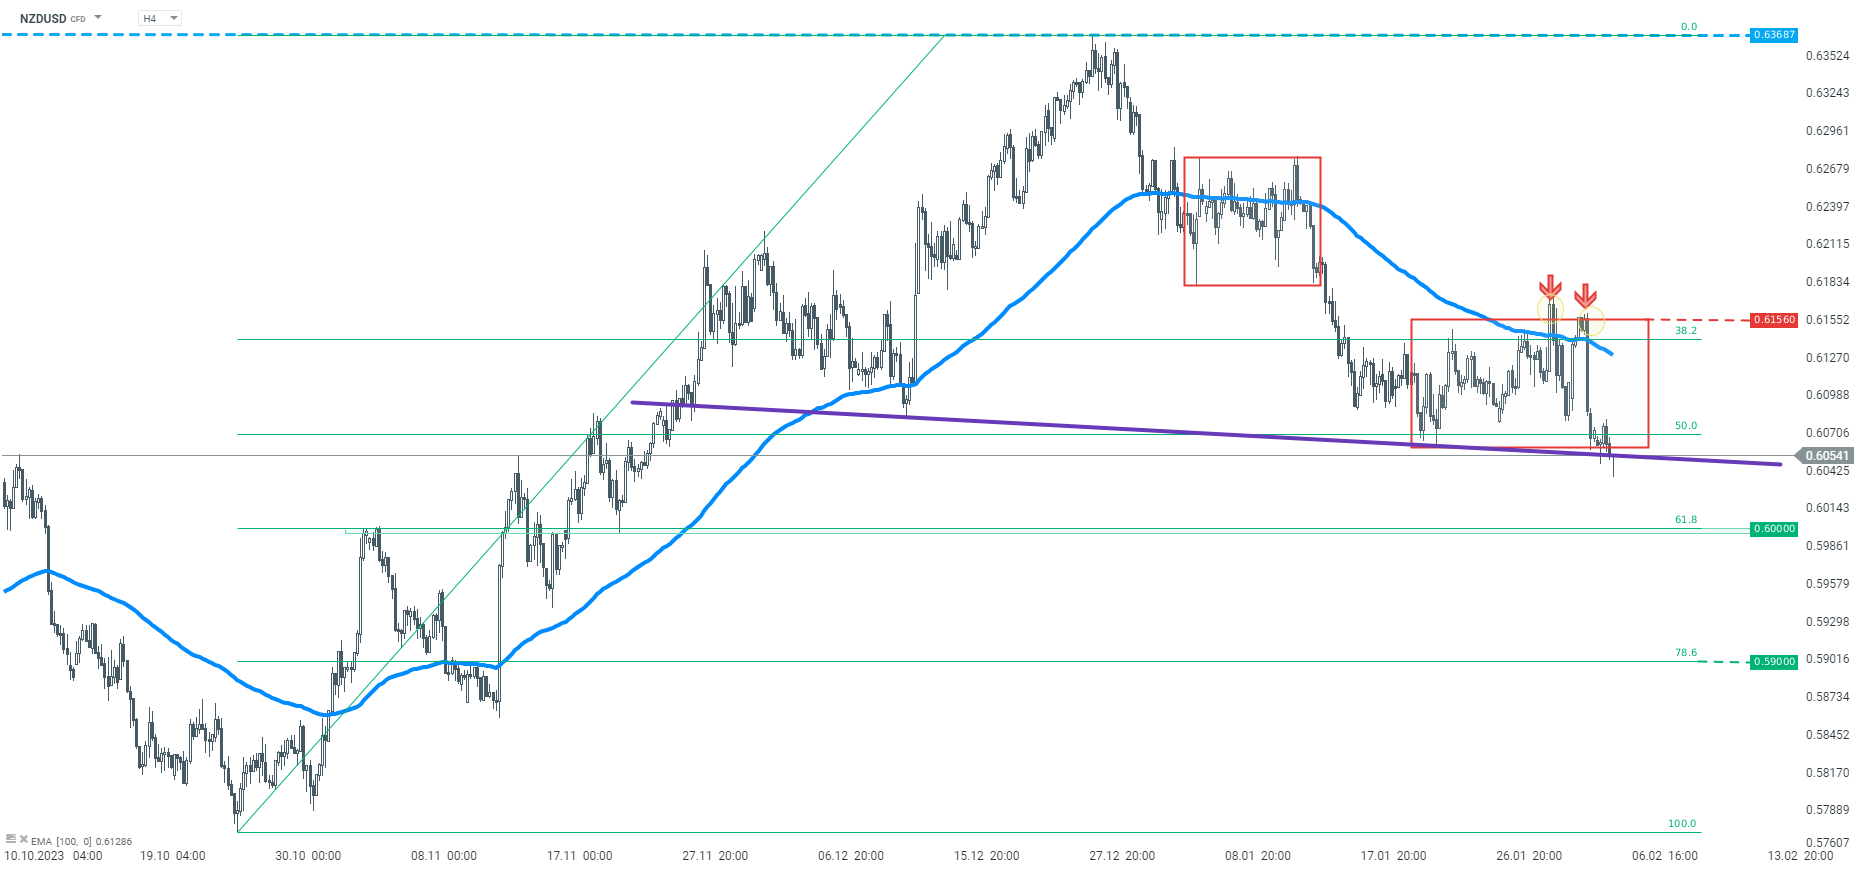 NZDUSD H4 interval. Source: xStation5
Healy makes first move as Chancellor, but bond market not impressed

Markets give a thumbs down to Burnham, as bond yields rise

Market Wrap: Airlines Under Pressure, Europe Resists Expensive Oil

Burnham takes the reigns
This content has been created by XTB S.A. This service is provided by XTB S.A., with its registered office in Warsaw, at Prosta 67, 00-838 Warsaw, Poland, entered in the register of entrepreneurs of the National Court Register (Krajowy Rejestr Sądowy) conducted by District Court for the Capital City of Warsaw, XII Commercial Division of the National Court Register under KRS number 0000217580, REGON number 015803782 and Tax Identification Number (NIP) 527-24-43-955, with the fully paid up share capital in the amount of PLN 5.869.181,75. XTB S.A. conducts brokerage activities on the basis of the license granted by Polish Securities and Exchange Commission on 8th November 2005 No. DDM-M-4021-57-1/2005 and is supervised by Polish Supervision Authority.