The price of oil has dropped big since the beginning of this week, and it's impossible not to link it to the current turmoil related to the banking sector around the world. WTI crude oil was trading in the $75-76 per barrel range last week, while on March 15 it even fell to around $66 per barrel. The key question for financial markets, however, is where oil has been in the past year and what implications this may have for them.
What was behind the price drop?
The market was very much afraid of a repeat of the problems in the banking sector that we saw in 2007-2009. At that time, oil prices dived very sharply, although the basis for that decline was different than now. OPEC itself has indicated that the current declines are linked to financial sector concerns rather than the fundamental situation. It is worth noting that when liquidity is sought, all the most liquid positions are closed, and in the case of the oil market, these positions are easily closed. Oil has been facing low financial market exposure for a long time anyway, so an even stronger exit by participants has led to a strong pullback.
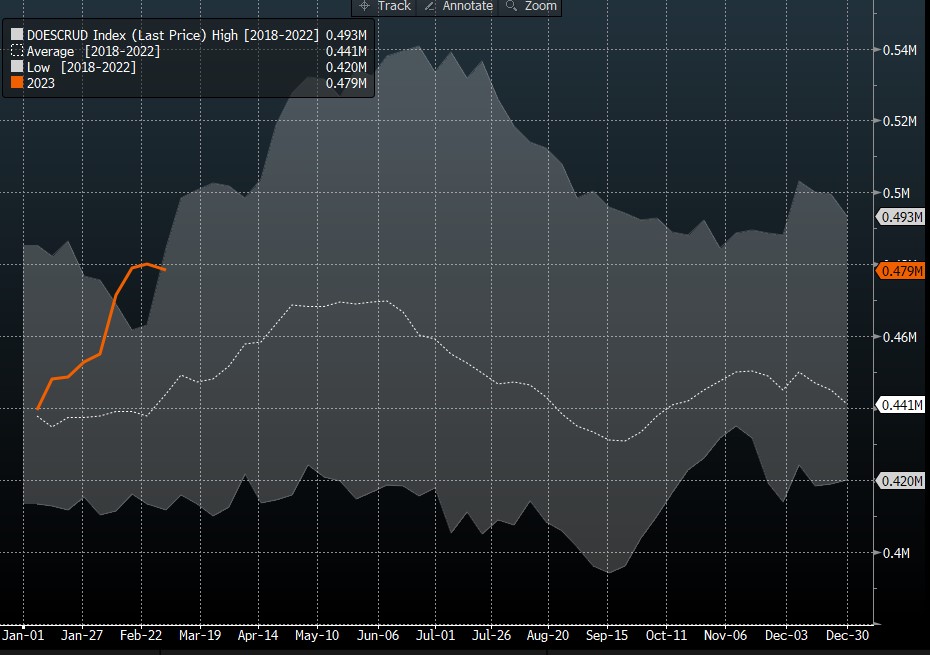
In addition, it is worth mentioning the state of US oil stocks themselves, which remain very high. Previous data showed the first decline since December, which could indicate a possible change in the trend in inventories. However, yesterday's data showed that inventories are rising again, and these remain high in the historical context.
 Inventories remain high. Source: Bloomberg
Where are prices now and where were they a year ago?
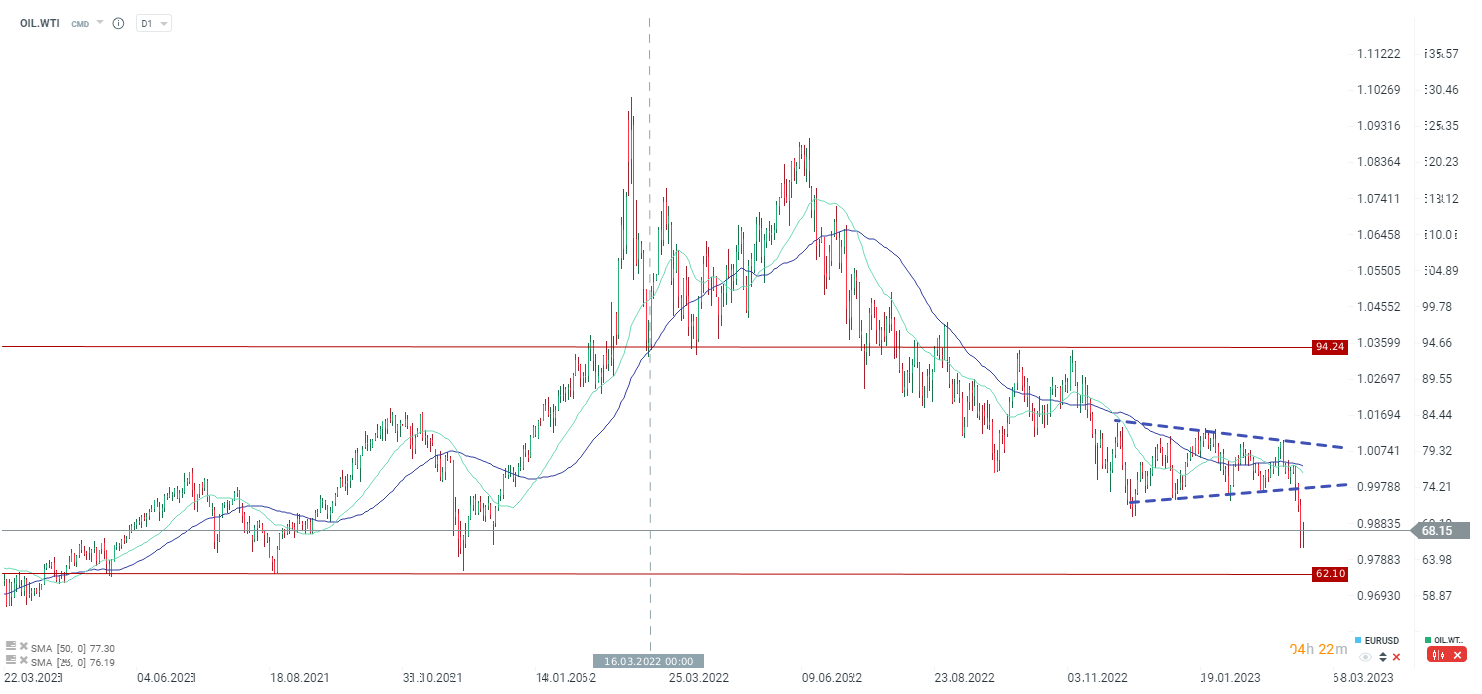
It's worth mentioning that a year ago we had the start of the war in Ukraine and massive concerns about oil availability. The price range last year was huge - starting with the peak near $130 per barrel for WTI crude, which traded near $130, or the local bottom near $92, which traded just around March 15-16. The bottom was much lower than current prices anyway, which is a very important aspect for inflation. An even more important aspect is average prices. March 2022 average prices were in the range of $110-114 per barrel. Currently it is closer to $70-72 per barrel.
 Prices last year oscillated between $92 and even $130. Currently, prices are oscillating between $66 and $80 per barrel. Source: Bloomberg
Is this a new trend?
If governments and central banks deal with the problems of the "run" on the banks, oil should return to higher ranges. Of course, there are a few question marks over demand, as data from the US showed a build-up in oil inventories, and China is not buying more, despite opening up its economy. Nonetheless, it appears that the US oil inventory build-up is dictated in part by sizable imports and a desire to make up for losses in strategic reserves later. China, on the other hand, is currently using its inventories to jump-start its economy. Moreover, Goldman Sachs indicates that the Chinese economy should grow faster. In view of this, there is still an expectation that oil prices should be higher later in the year, although the current fragile situation in the markets makes the basis for higher prices begin to be questionable.
Nevertheless, low oil prices are a very good situation for markets, central banks and economies. Much lower prices, especially those in the $60-70 range, are acceptable with moderate economic growth. In contrast, at $60 per barrel and with the "discount" that Russia offers its counterparties, the country does not make money or may even take a hit on every barrel sold.
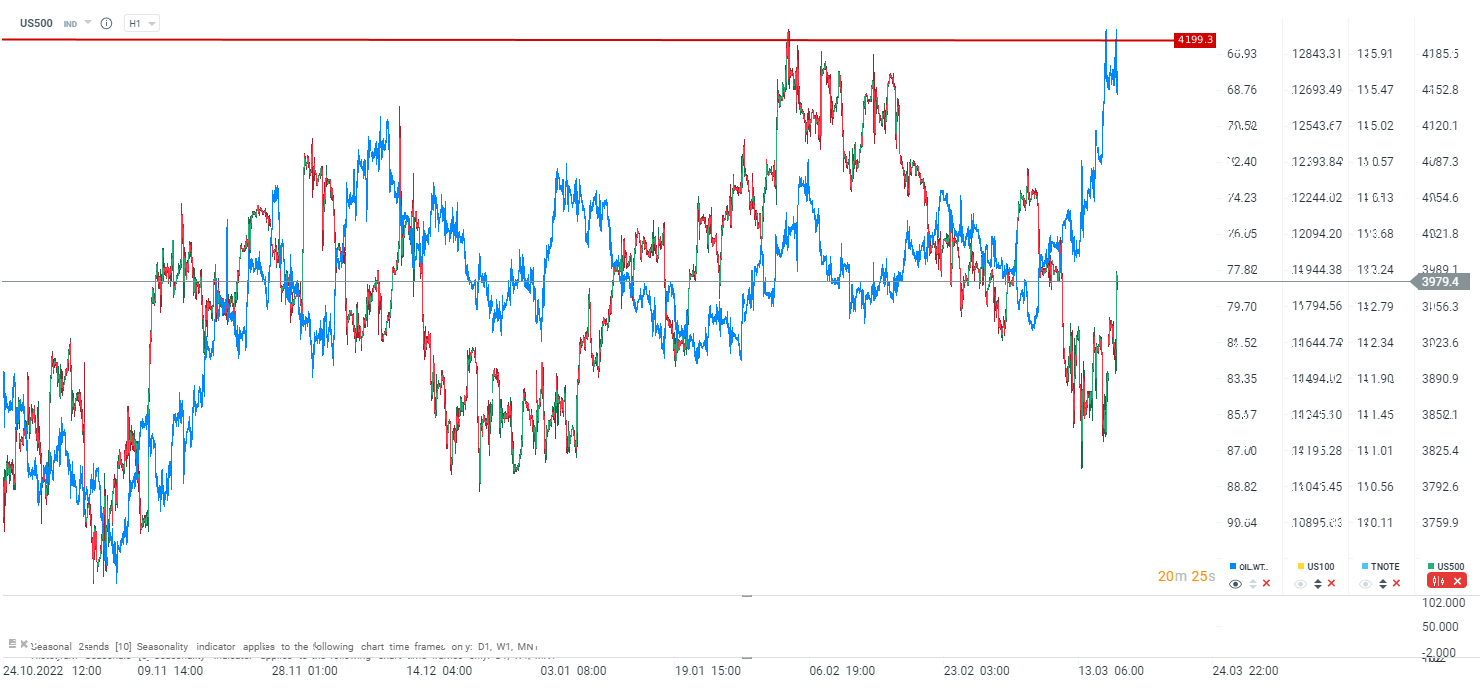
 Lower OIL prices in the short term may herald more bullish sentiments on the stock market. Source: xStation5
Morning wrap (31.10.2025)
Daily Summary: ECB, FOMC and MAG7 - mixed signals and risk aversion
BREAKING: EIA gas inventories change slightly above expectations. NATGAS increase after EIA data 📌
Breaking: Update on Soybean - China to Buy 12 mt Soy This Year
This content has been created by XTB S.A. This service is provided by XTB S.A., with its registered office in Warsaw, at Prosta 67, 00-838 Warsaw, Poland, entered in the register of entrepreneurs of the National Court Register (Krajowy Rejestr Sądowy) conducted by District Court for the Capital City of Warsaw, XII Commercial Division of the National Court Register under KRS number 0000217580, REGON number 015803782 and Tax Identification Number (NIP) 527-24-43-955, with the fully paid up share capital in the amount of PLN 5.869.181,75. XTB S.A. conducts brokerage activities on the basis of the license granted by Polish Securities and Exchange Commission on 8th November 2005 No. DDM-M-4021-57-1/2005 and is supervised by Polish Supervision Authority.


