
Summary:
- DOE crude oil inventories: +2.1M vs -2.0M exp
- API inventories showed -2.0M
- Oil.WTI back under pressure and near weekly lows
The recent price action in Oil has turned distinctly bearish, with sizable declines noticeable after the market reversed lower not long after last week’s inventory figure. The reading this time out has done little for crude bulls with a print of +2.1M well above both the expected -2.0M and the prior -3.6M. Comparing the reading to last night’s API number doesn’t make for any better reading, with Tuesday’s private release showing a decline 2.0M.
Looking at the components of the inventory report as actual vs expected we got:
- Crude oil: +2.1M vs -2.0M
- Gasoline: +4.6M vs +0.5M
- Distillates: +2.2M vs +0.8M
- Cushing: -1.0M vs -0.6M
In addition to each individual component, the weekly oil production in the US has become a key metric to watch. This rose once more in the past week, increasing by 31k to 10.8m barrels per day - another record high. Looking at a chart of US production over the past 5 years it is clear that there’s been a fairly strong overall uptrend and this is showing little sign of slowing down. 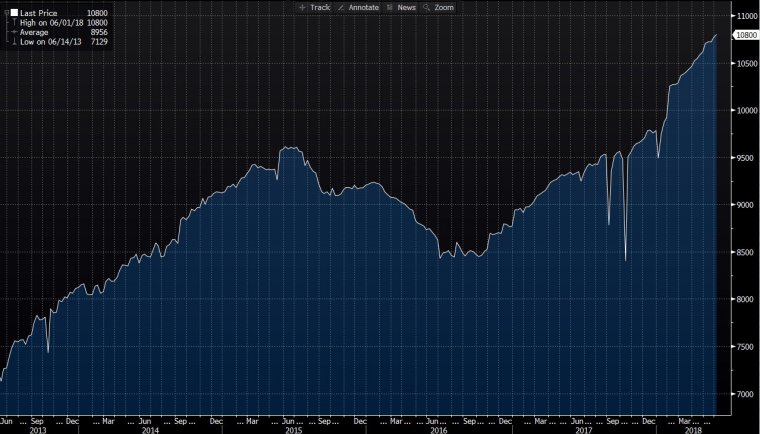
US production increased once more last week, rising to another record high. Source: Blooomberg
Turning our attention to the market reaction, it has unsurprisingly been negative with Oil.WTI falling over 100 ticks since the data dropped. Last week’s DOE saw the market make a head fake higher after the DOE drawdown before embarking on a near week long decline. Tuesday’s low of 64.24 is a level to look for possible support but if price breaks below there then there could be another leg lower.
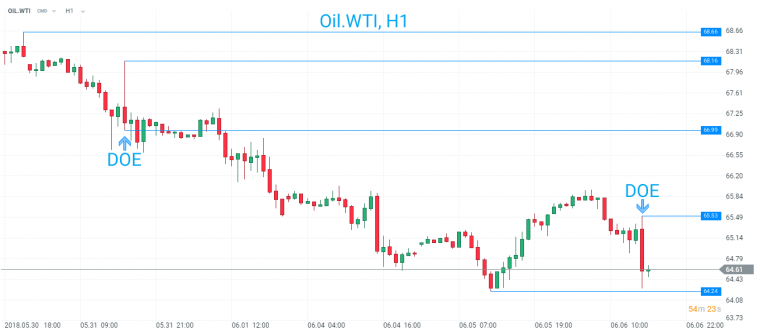
Oil.WTI has fallen lower after the DOE release and if the swing low of 64.24 fails to hold then the downtrend may continue. Source: xStation
The declines seen in recent days have caused price to break a long-term trendline going back to the tail-end of last summer and this could be seen to indicate the end of the near year-long uptrend. The market gained almost $30 in this time but the latest price action looks pretty negative and if there’s another red close today then it will mark 10 daily declines in the past 12 sessions.
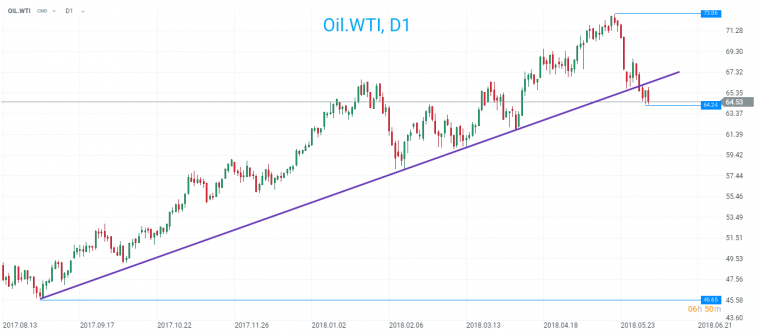
Oil.WTI has broken a long-term trendline and could now be set to retrace some of the gains seen over the past 12 months. Source: xStation
Disclaimer
This article is provided for general information purposes only. Any opinions, analyses, prices or other content is provided for educational purposes and does not constitute investment advice or a recommendation. Any research has not been prepared in accordance with legal requirements designed to promote the independence of investment research and as such is considered to be a marketing communication. Any information provided does not have regard to the specific investment objectives, financial situation and needs of any specific person who may receive it.
Past performance is not necessarily indicative of future results, and any person acting on this information does so entirely at their own risk, we do not accept liability for any loss or damage, including without limitation, any loss of profit, which may arise directly or indirectly from the use of or reliance on such information.