



Gold is struggling this week as the oil price is back above $100 per barrel and as bond yields surge globally. The rise in government borrowing costs is a big problem for an asset like gold because it does not yield anything, and becomes less attractive when yields rise elsewhere.
This means that the big picture for gold is that for as long as energy prices are rising, inflation increases and the market is pricing in an aggressive interest rate hiking cycle around the world, the gold price is likely to struggle.
However, if you drill down a bit deeper, it is impressive that even with these downside risks the gold price has managed to stay above $4,000 oer ounce. This is a critical support level that has held extremely well, and it suggests that there remains solid demand for gold, even if the road is bumpy in the short term.
On a longer term basis, the gold price remains in an uptrend, although it is having a rough time in the short and medium term and is lower by 10% in a month. Ahead of the $4,000 support level, it is worth watching $4110, which is a key support now that the gold price has slipped below $4,200 per ounce.
Although some analysts still believe that gold could go back to $5,000 per ounce, we think that the only way for the gold price to stage a meaningful recovery is for the dollar to fall. A return of the dollar debasement trade would boost the price of gold in our view. However, even though US Treasuries have fallen sharply and experienced their worst quarter since 1994, the dollar is higher by 2.5% in the past month, and continues to attract safe haven flows.
If the sell off in gold continues, short term support levels to watch include $4110, $4,000, and a deper sell off could see the yellow metal fall to $3985, the low from mid-June.
If the oil price eases significantly, or if there is a decline in the dollar, then we may see a short term recovery in the price of gold, and initial resistance lies at $4,200, and then $4,300, prior support from earlier in September.
Chart 1: The gold price, 1-month chart
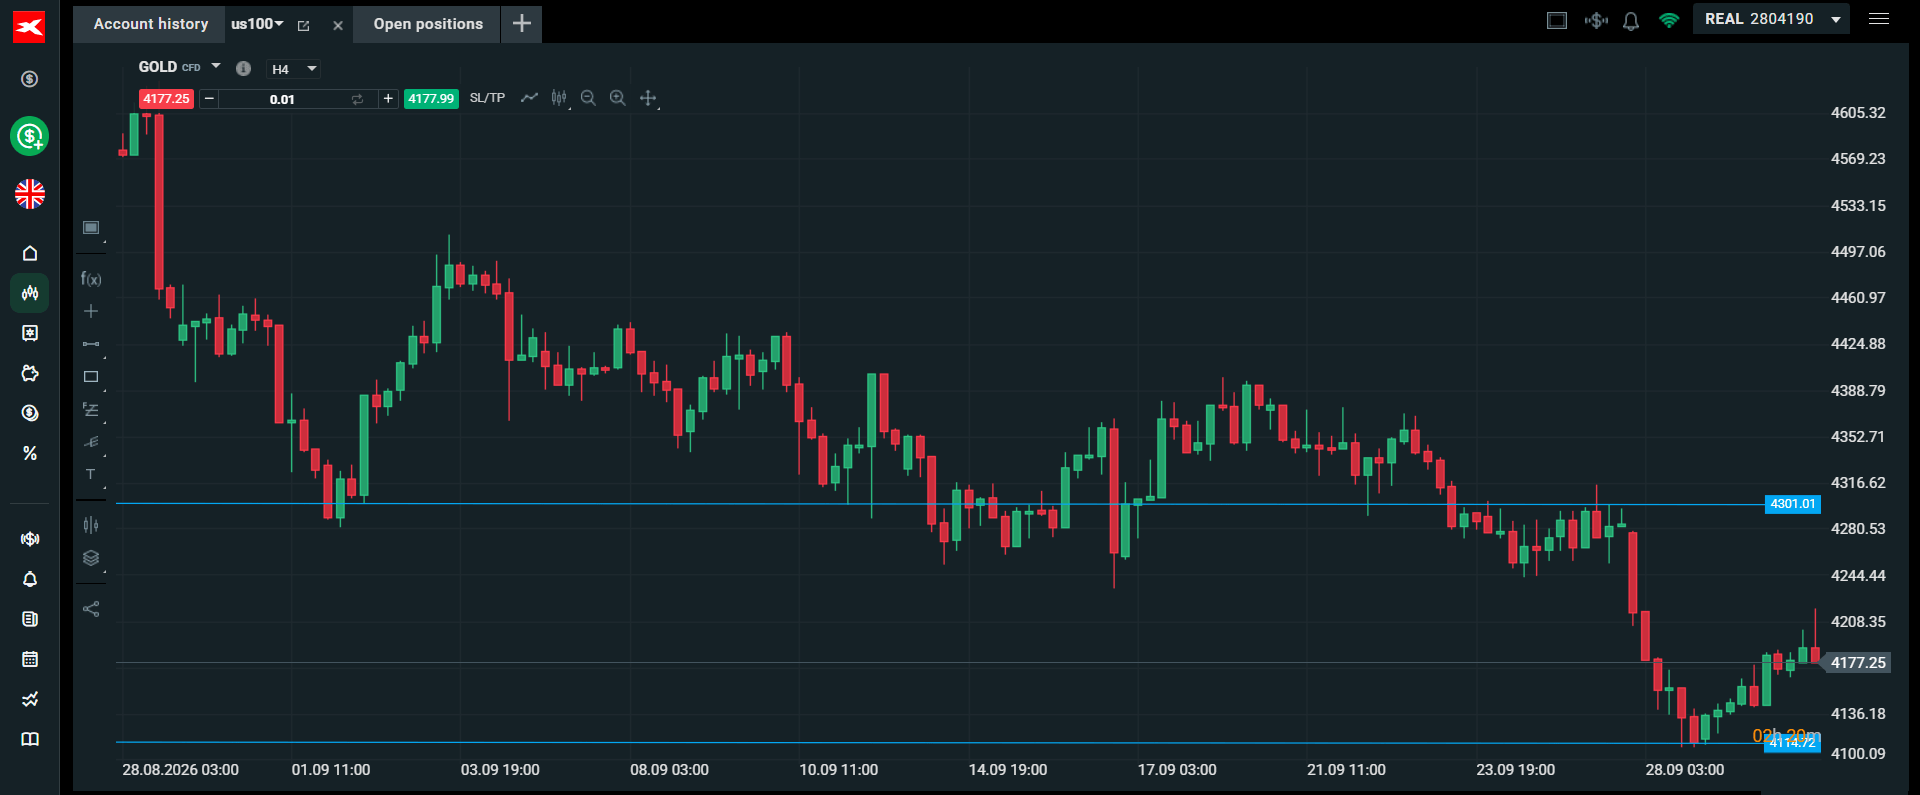
Source: XTB. Past performance is not a reliable indicator of future results.



Economic Calendar: Markets Await Reports from Procter & Gamble and Western Digital 💡


Daily Summary: SpaceX and the tech sector drive Wall Street, oil retreats sharply below $97


Russia is selling off gold reserves. Why, to whom, and does it matter for the market?

BREAKING: US oil inventories fall more than expected, but distillate build cools enthusiasm
This content has been created by XTB S.A. This service is provided by XTB S.A., with its registered office in Warsaw, at Prosta 67, 00-838 Warsaw, Poland, entered in the register of entrepreneurs of the National Court Register (Krajowy Rejestr Sądowy) conducted by District Court for the Capital City of Warsaw, XII Commercial Division of the National Court Register under KRS number 0000217580, REGON number 015803782 and Tax Identification Number (NIP) 527-24-43-955, with the fully paid up share capital in the amount of PLN 5.869.181,75. XTB S.A. conducts brokerage activities on the basis of the license granted by Polish Securities and Exchange Commission on 8th November 2005 No. DDM-M-4021-57-1/2005 and is supervised by Polish Supervision Authority.