
Looking at the gold market on H4 interval, one can see that the price is once again testing the key resistance area. The zone marked with a purple colour on the screen below results from the upper limit of 1:1 structure and previous price reactions. According to the classic technical analysis, as long as the price sits below the $1,915, continuation of the downward move looks possible. However, one should keep in mind that the chance of breaking above increases with each subsequent test.
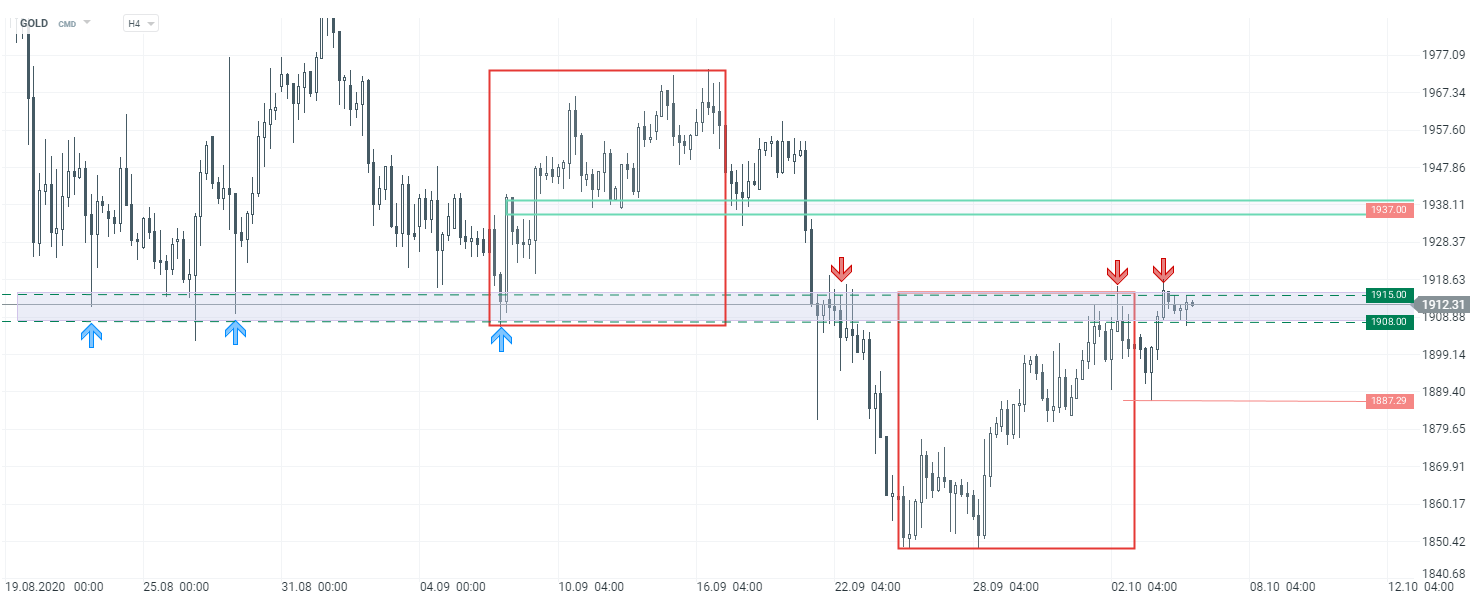 GOLD H4 interval. Source: xStation5

When will the rise in oil prices reach us?

Daily Summary: Equities Diverge as Tech Lags, Europe Rallies on Earnings & PMIs (24.07.2026)

Three markets to watch next week (24.07.2026)

Oil Slides Ahead of the Weekend!
This content has been created by XTB S.A. This service is provided by XTB S.A., with its registered office in Warsaw, at Prosta 67, 00-838 Warsaw, Poland, entered in the register of entrepreneurs of the National Court Register (Krajowy Rejestr Sądowy) conducted by District Court for the Capital City of Warsaw, XII Commercial Division of the National Court Register under KRS number 0000217580, REGON number 015803782 and Tax Identification Number (NIP) 527-24-43-955, with the fully paid up share capital in the amount of PLN 5.869.181,75. XTB S.A. conducts brokerage activities on the basis of the license granted by Polish Securities and Exchange Commission on 8th November 2005 No. DDM-M-4021-57-1/2005 and is supervised by Polish Supervision Authority.