



- The Dow Jones is down around 350 points, or 0.7%, the S&P 500 is lower by around 0.4%, while Nasdaq 100 futures are down roughly 0.7%.
- The yield on the 10-year U.S. Treasury is up more than 4 basis points to 4.696%, while the 30-year yield has risen to 5.236%, following Wednesday’s pullback triggered by the Treasury Department’s debt buyback plan.
- Oil is adding to the pressure, with Brent futures up around 3% and trading above $94 per barrel amid escalating tensions between the U.S. and Iran.
- Walmart is down 8% after U.S. comparable sales and adjusted earnings guidance for both the third quarter and full year disappointed some investors.
- The market remains sensitive to the U.S. fiscal deficit and rising defense spending, which could keep long-term Treasury yields under upward pressure.
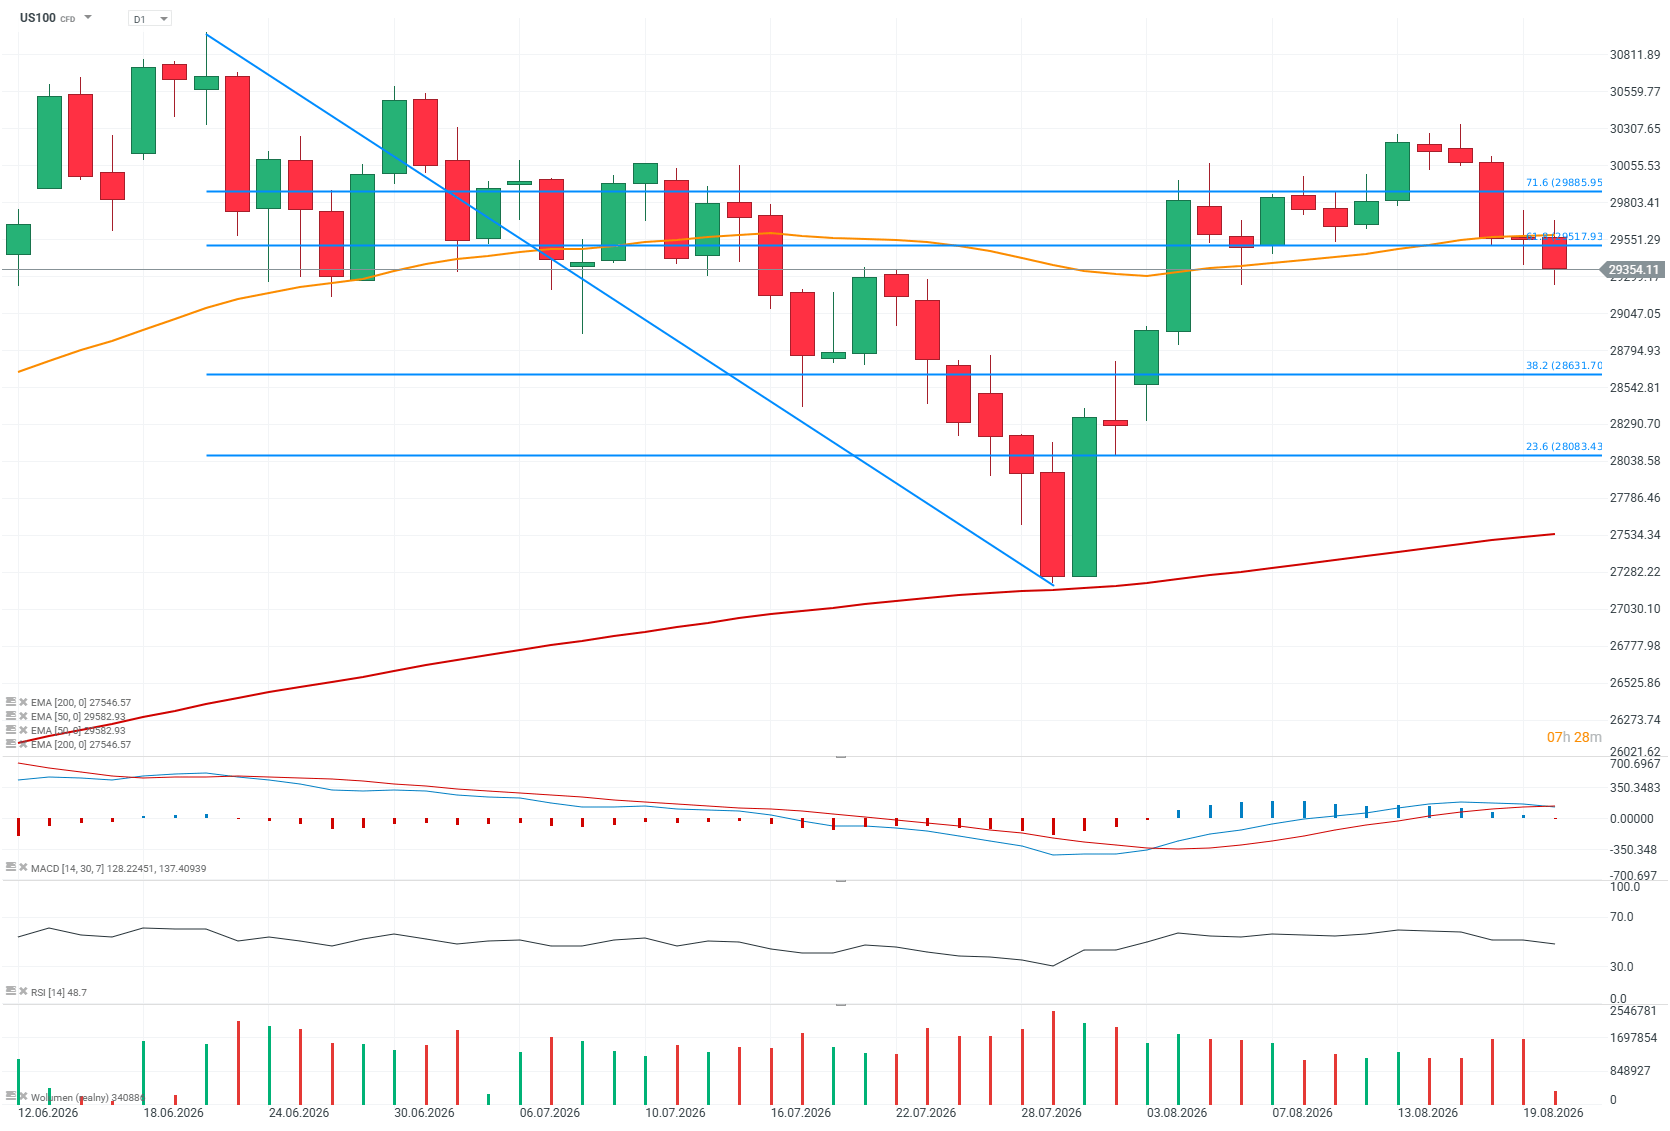
US100 chart on the daily interval (D1)
Nasdaq 100 futures are down more than 0.7%, while the renewed jump in yields is giving bulls little room to recover. The index failed to maintain bullish momentum above the EMA50, shown by the orange line, and has pulled back toward 29,300 points and the 61.8% Fibonacci retracement of the latest downward impulse. An important support level now sits around 28,600 points, where the 38.2% Fibonacci retracement overlaps with previous price reactions. Key resistance, in turn, is located near 30,000 points, around the 71.6% Fibonacci retracement.
 Source: xStation5
Nasdaq 100 remains fundamentally strong, but valuation leaves little room for error
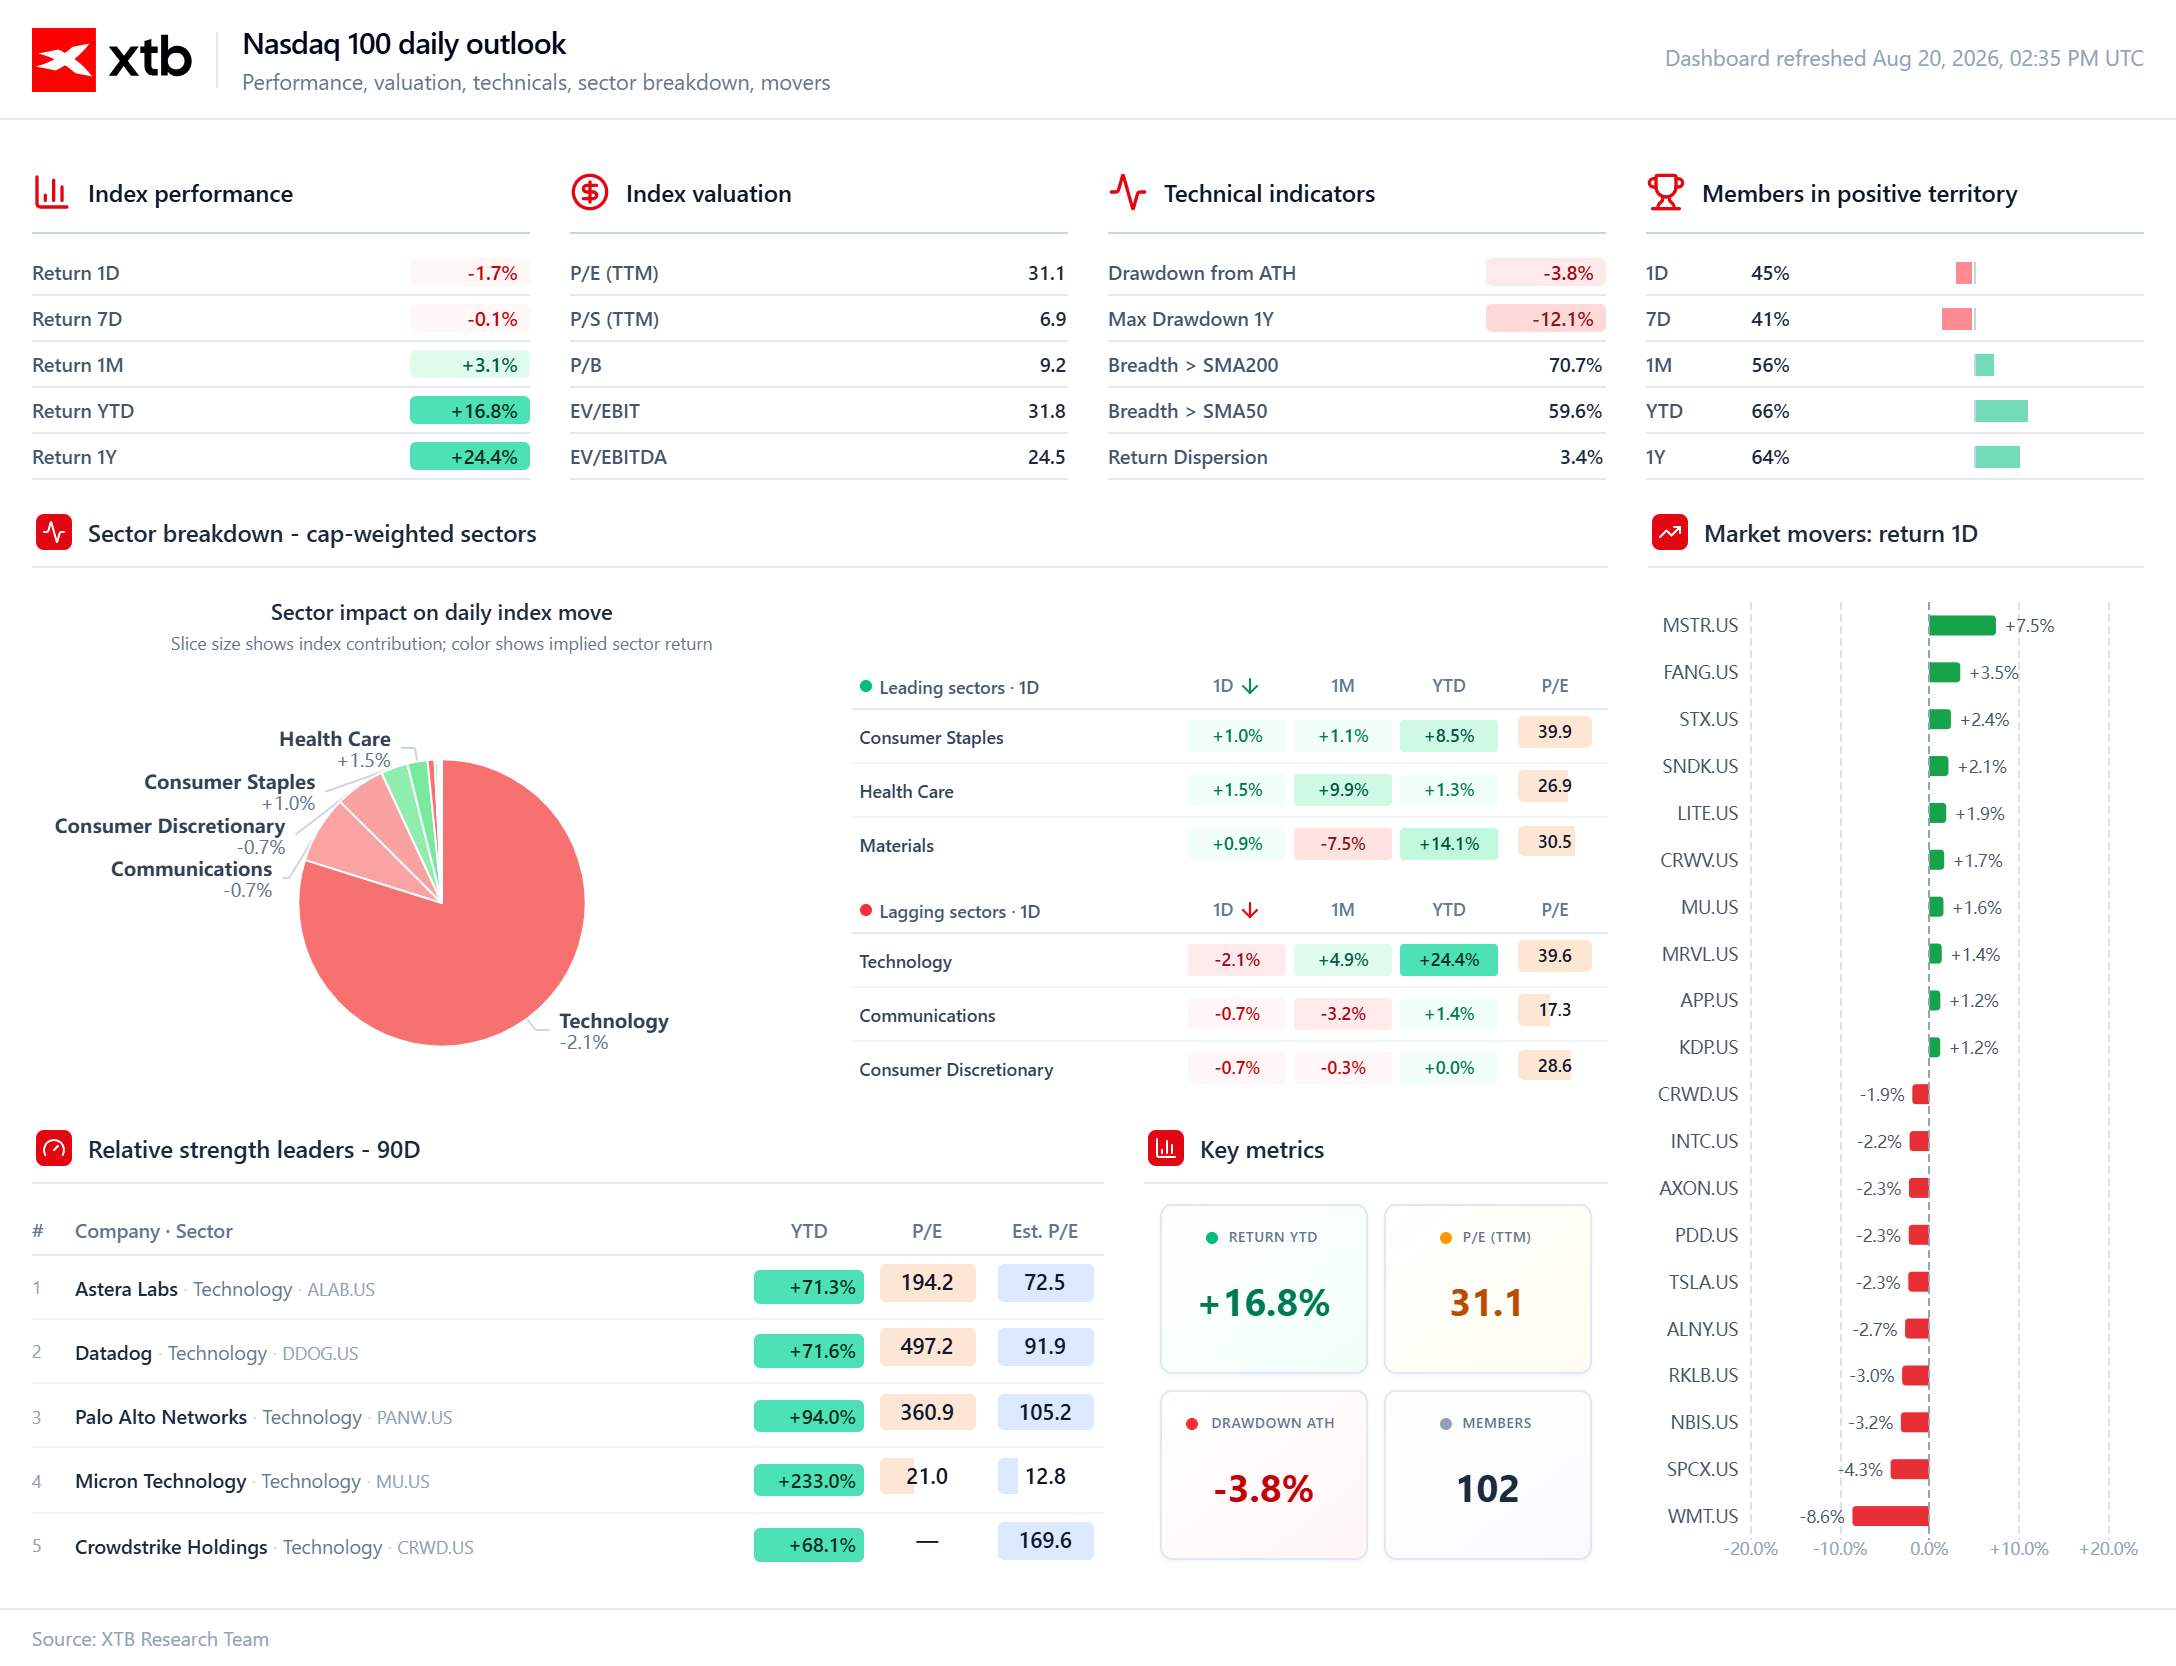
The second chart shows a Nasdaq 100 that still has a strong medium-term trend, but is becoming increasingly vulnerable in the short term to pressure from higher bond yields. The index is around 3.8% below its all-time high, while 70.7% of its constituents remain above the SMA200 and nearly 60% are still above the SMA50, suggesting that market breadth has not yet deteriorated into a classic trend breakdown. The bigger issue lies in valuation: a trailing P/E of 31.1x, EV/EBITDA of 24.5x and P/S of 6.9x mean investors are paying a very high price for future earnings growth, particularly in technology. Today’s sector structure reflects that clearly — technology is down around 2.1%, while healthcare and consumer staples are holding up better, which looks like a rotation out of duration-sensitive growth and into more defensive cash-flow profiles. In my view, Nasdaq does not currently have a problem with business quality, but with the price investors have already paid for that quality — at these multiples, further upside requires not only strong earnings but also stable or lower yields, otherwise valuation compression may outpace earnings growth.
Source: XTB Research
Dow Jones — rotation beneath the surface and a high penalty for disappointment
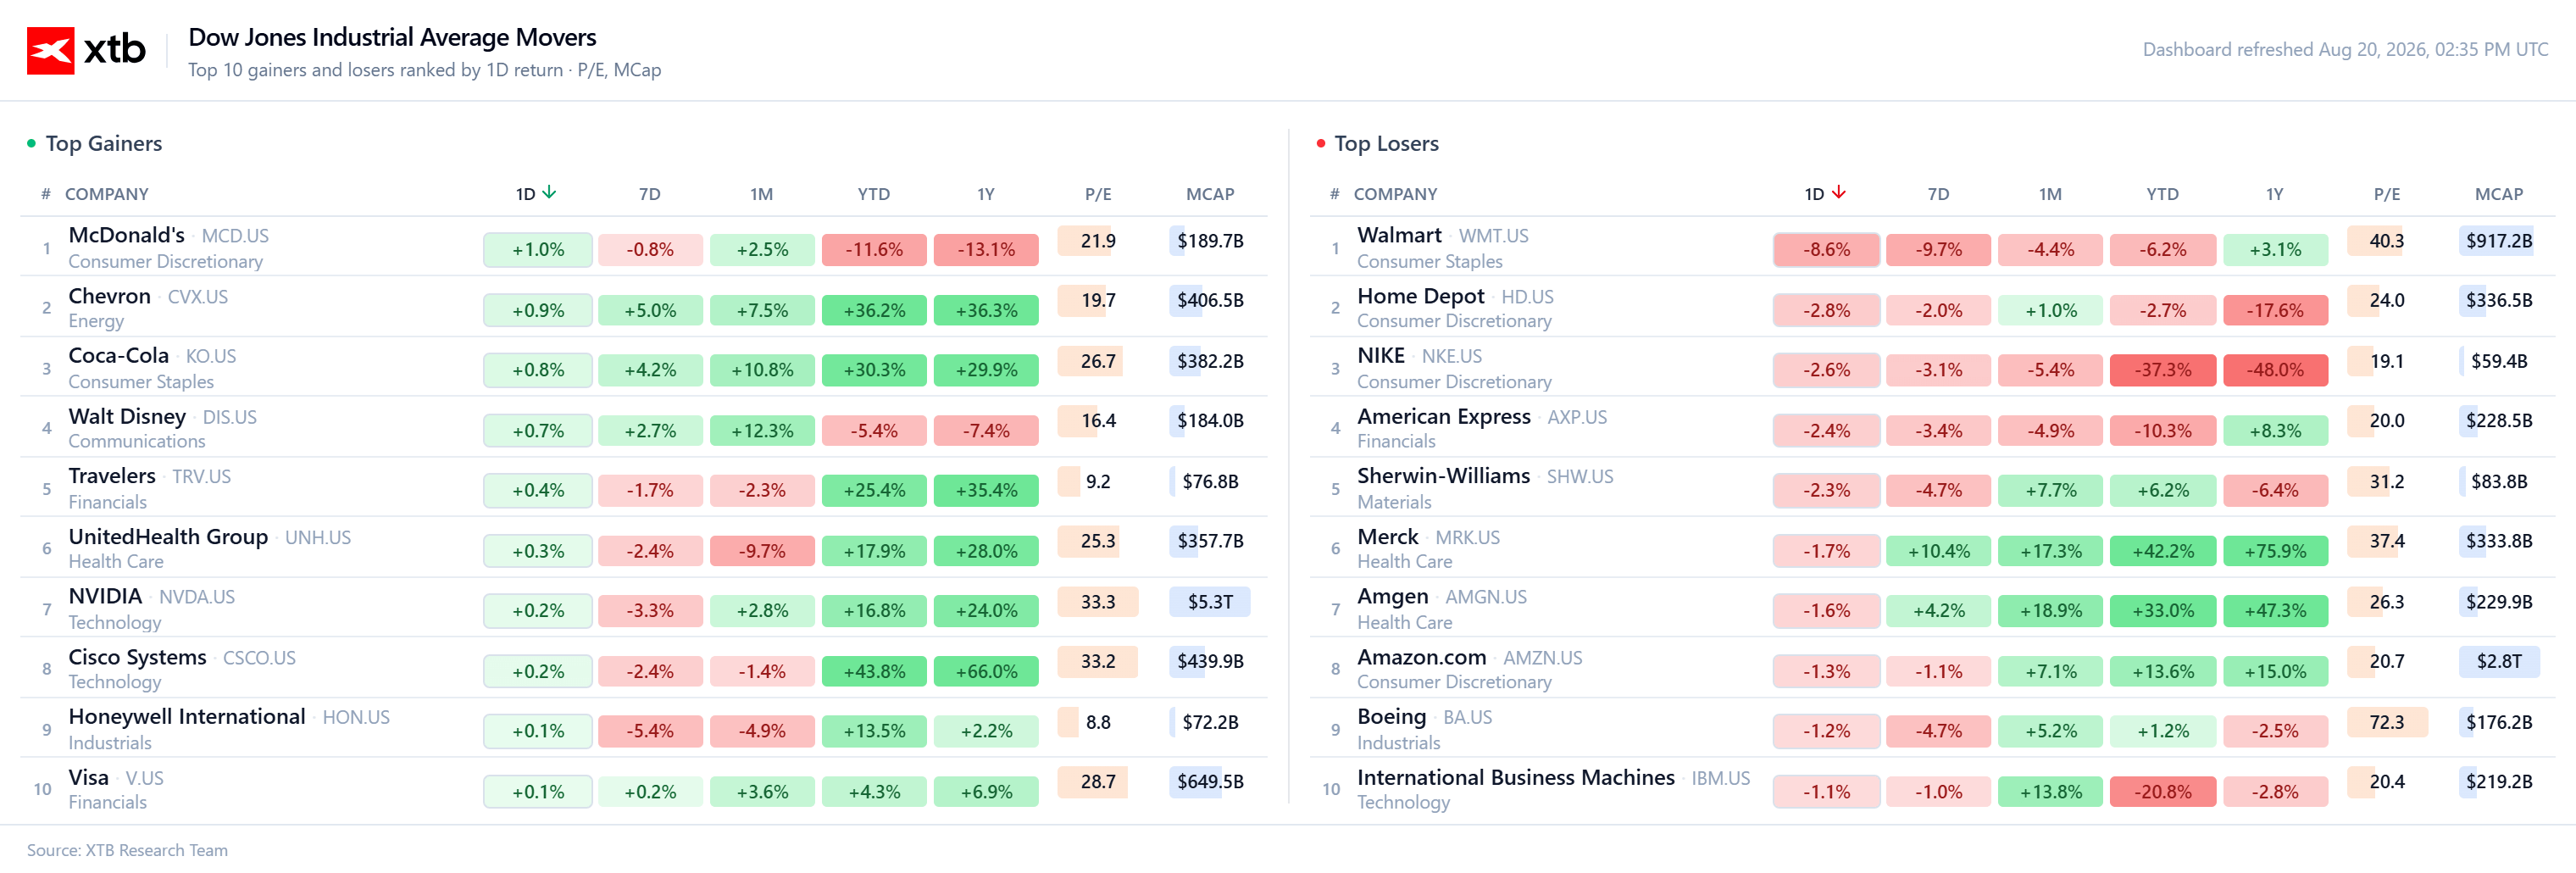
The first chart shows a highly selective session in the Dow Jones: the index is not being sold indiscriminately, but capital is clearly rotating between sectors and individual stocks. Walmart is the biggest loser, down around 8.6%, and with a market capitalization close to $917 billion that move has a meaningful impact on sentiment; equally important, however, is the fact that the stock still trades at around 40.3x earnings, leaving little tolerance for even modest disappointments relative to expectations. On the other side are Chevron, Coca-Cola and McDonald’s, suggesting investors are not abandoning the market altogether but are shifting toward more defensive businesses or those less sensitive to higher yields. The valuation contrast is also striking: Travelers at around 9.2x earnings and Honeywell at 8.8x look very different from Walmart or technology names trading above 30x, meaning today’s session is rewarding resilient cash flows and lower expectations embedded in price. The market is not questioning the fundamentals of the entire economy, but it is becoming much more aggressive in compressing valuations where investors had previously paid for near-perfect execution.
Source: XTB Research
Rebounding yields are weighing on Wall Street again
Wednesday’s relief in the bond market has so far proved short-lived. The Treasury Department announced plans to increase buybacks of 10-, 20- and 30-year securities, which temporarily pushed yields lower and improved equity sentiment, but just one day later the long end of the curve is selling off again. That suggests the underlying problem has not been resolved, only temporarily eased.
For equities, this matters because higher 10- and 30-year yields effectively raise the discount rate applied to future cash flows. With the 30-year Treasury yield above 5.2%, investors begin to scrutinize equity valuations more aggressively, particularly among growth and technology companies. In that environment, even good earnings may not be enough if valuation multiples are already elevated.
Oil is adding another layer of pressure. Brent above $94 and WTI above $88 increase inflation concerns and, indirectly, the risk that interest rates remain high for longer. That is not a supportive backdrop for broad-based multiple expansion on Wall Street.
The bigger risk is that pressure on yields may be structural rather than temporary. A large fiscal deficit, rising Treasury supply and higher government spending could keep the long end of the curve elevated. If yields do not begin to fall on a sustained basis, equities may remain under selective pressure even if corporate fundamentals remain solid in parts of the market.
Philadelphia Fed: manufacturing surprises to the upside as price pressure eases
The Philadelphia Fed manufacturing index rose to 47.4 in August from 41.4 in July, comfortably beating the consensus forecast of 25 and reaching its highest level since April 2021. That is a strong signal from the regional manufacturing sector, particularly because the index measures the difference between the share of firms reporting expansion and those reporting contraction. The labor market component was even stronger. The employment index jumped to 27.9, up 18 points and reaching its highest level since April 2022. This suggests that companies are not only seeing stronger orders or production, but are also increasing hiring, reinforcing the picture of solid demand.
The contrast with inflation is particularly interesting. Measures of prices paid and received fell to their lowest levels since February, even as geopolitical tensions around Iran pushed energy prices higher and revived broader inflation concerns. The market is therefore seeing an unusual combination: stronger activity and employment alongside weaker pricing pressure within the manufacturing sector. From the Fed’s perspective, this is not an easy set of data to classify as clearly dovish or hawkish. Strong manufacturing and employment reduce the urgency for rapid easing, while softer price indicators point in the opposite direction. The key conclusion is that the economy is still showing considerable resilience, and the scenario of a sharp slowdown is not yet being confirmed by the Philadelphia data.
Company news
- Merck remains under pressure despite positive results from a large cancer vaccine trial. TD Cowen maintained its “hold” rating, arguing that the success was partly expected after strong Phase II data and that the potential breadth of the therapy remains uncertain; its price target stands at $137 versus Wednesday’s closing price of $152.20.
- Crypto-related stocks are rising sharply after Donald Trump called on Congress to pass more industry-friendly regulation: Coinbase and Mara Holding are up around 6% each, Strategy is gaining about 10%, Circle Internet is up 5%, and American Bitcoin is rising nearly 7%.
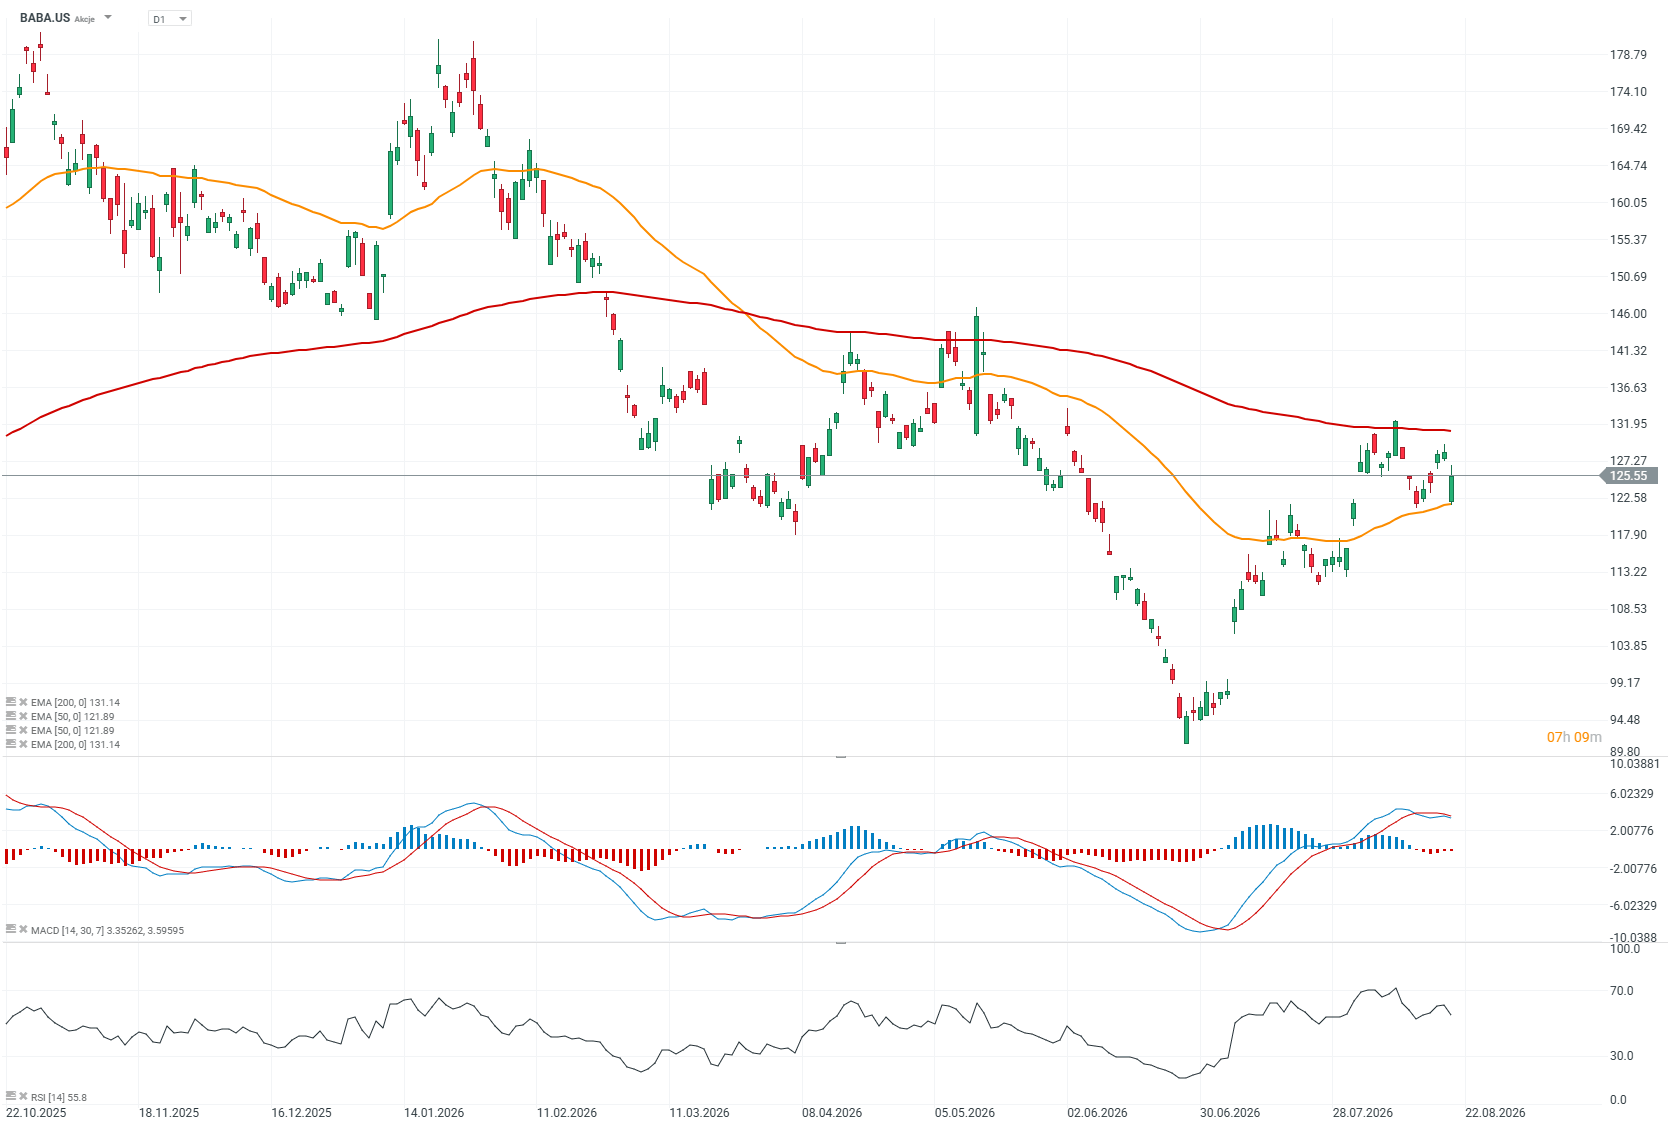
- Alibaba is recovering from earlier losses after opening the session about 3% lower, following a 75% drop in quarterly profit that was linked to a sharp increase in artificial intelligence spending.
Alibaba share price chart (D1 interval)
 Source: xStation5


Tesla was supposed to burn $5 billion, but posted a positive result. Will Tesla still be a car company in a year?


Record-breaking Meta, though with a cash loss. Investors (for now) are buying Zuckerberg's plan anyway


Daily Summary: SpaceX and the tech sector drive Wall Street, oil retreats sharply below $97

US OPEN: Preparations for Tesla's mega-merger with SpaceX. Diplomatic stalemate with Iran cools Wall Street's enthusiasm
This content has been created by XTB S.A. This service is provided by XTB S.A., with its registered office in Warsaw, at Prosta 67, 00-838 Warsaw, Poland, entered in the register of entrepreneurs of the National Court Register (Krajowy Rejestr Sądowy) conducted by District Court for the Capital City of Warsaw, XII Commercial Division of the National Court Register under KRS number 0000217580, REGON number 015803782 and Tax Identification Number (NIP) 527-24-43-955, with the fully paid up share capital in the amount of PLN 5.869.181,75. XTB S.A. conducts brokerage activities on the basis of the license granted by Polish Securities and Exchange Commission on 8th November 2005 No. DDM-M-4021-57-1/2005 and is supervised by Polish Supervision Authority.