
Summary:
-
Ethereum moves within the triangle pattern, two crucial levels to watch
-
Litecoin breaks through the lower limit of the bullish channel
-
Bitcoin’s range trading narrows significantly suggesting more nervous times ahead
Although all cryptocurrencies tend to move in the same direction, they diverge from time to time. In today’s post we are focusing on three major digital coins which seem to be especially interesting from a technical point of view. Let’s begin with Ethereum.

The price of Ethereum is moving within the triangle formation but given the fact that we are approaching the end of this pattern, one may expect that the cryptocurrency will experience more nervous moves. What could happen? The H4 chart suggests that the downside could be limited even as the price moves through the lower boundary of the above-mentioned pattern. If it happens, buyers may hope for a counterattack in the vicinity of $206 where one may identify the relevant demand zone. On the flip side, a move through the upper bound could bring the price as high as $255. Notice that this area halted buyers in September after the rally. Source: xStation5
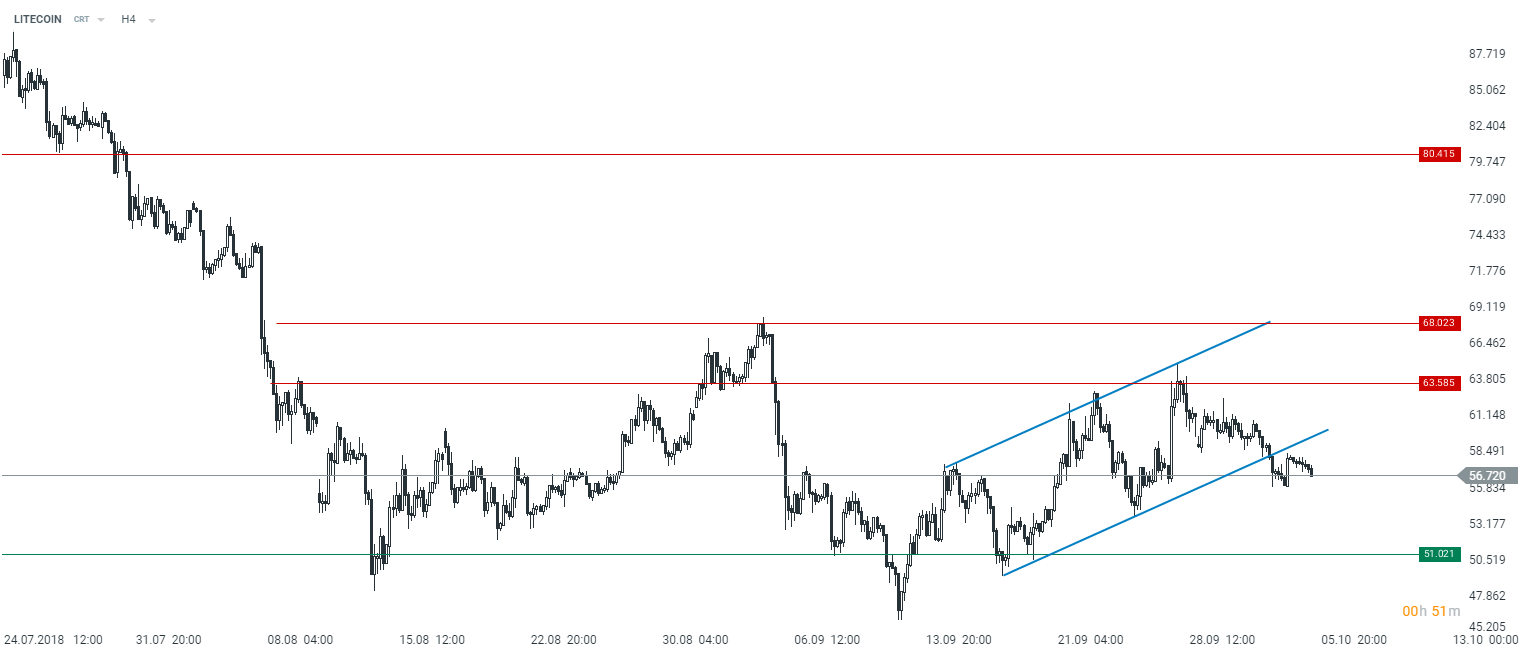 Unlike Ethereum the price of Litecoin has been falling in recent hours. As a result, the price moved through the lower bound of the upward channel. Therefore, it seems to be reasonable to expect the price to continue moving south even toward $51 where the first more notable support could be localized. What would have to happen to change this direction? It appears that the price would need to come back toward the channel anew and then try to break above $63. Having said that, it looks the less likely scenario for the time being. Do notice that bulls already attempted to do so but they failed and then sellers began prevailing again. Source: xStation5
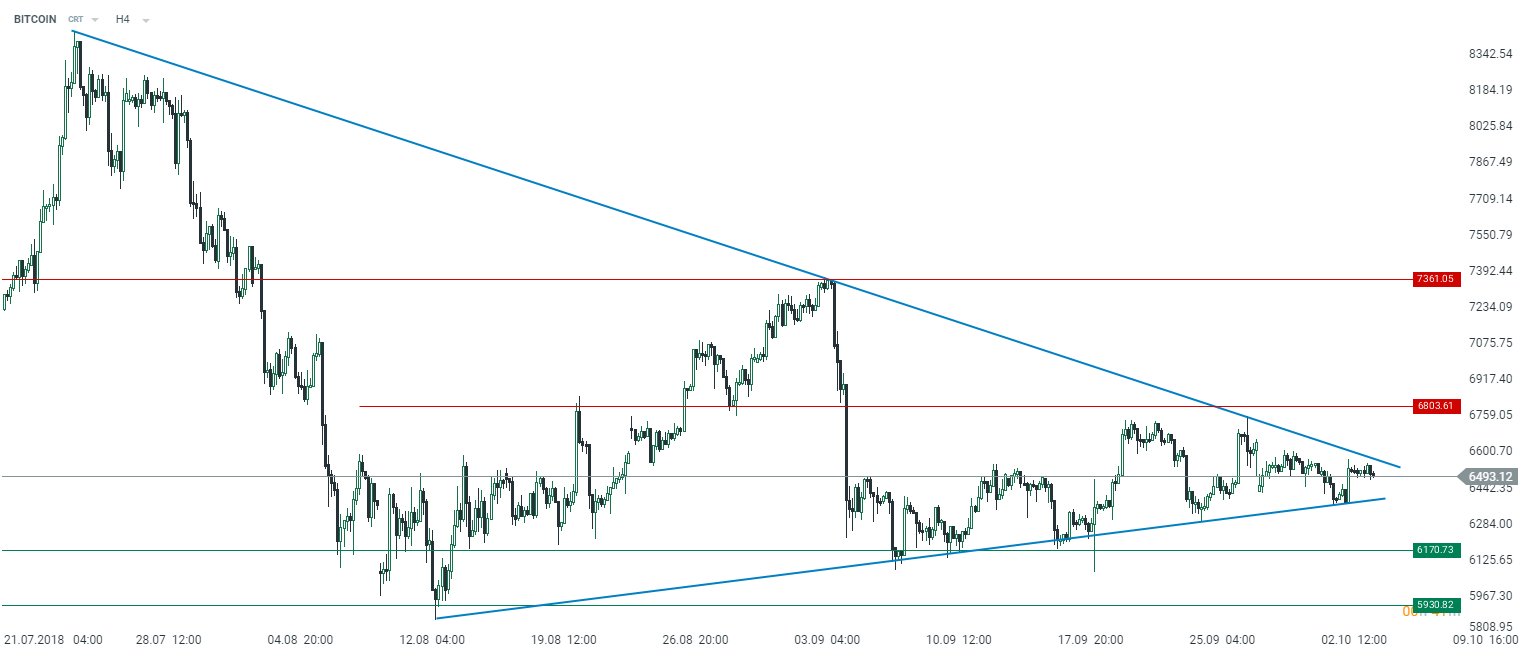 Last but not least, the technical outlook for Bitcoin resembles the Ethereum chart as both cryptocurrencies are coming to an end of their triangle patterns. In case of the former we have already written about this line formation repeatedly. What to expect next? One may spot that space for a possible increase or decrease (depending on where the price will move after leaving the triangle) seems to be similar - the first resistance and support are placed at $6800 and $6170 respectively. However, if Bitcoin moves through $6800 successfully it could open the way to a further move up to $7360. This is not the case if the price breaks below the lower limit of the channel as the possible downward move seems to be limited to $5930. Source: xStation5
This content has been created by XTB S.A. This service is provided by XTB S.A., with its registered office in Warsaw, at Prosta 67, 00-838 Warsaw, Poland, entered in the register of entrepreneurs of the National Court Register (Krajowy Rejestr Sądowy) conducted by District Court for the Capital City of Warsaw, XII Commercial Division of the National Court Register under KRS number 0000217580, REGON number 015803782 and Tax Identification Number (NIP) 527-24-43-955, with the fully paid up share capital in the amount of PLN 5.869.181,75. XTB S.A. conducts brokerage activities on the basis of the license granted by Polish Securities and Exchange Commission on 8th November 2005 No. DDM-M-4021-57-1/2005 and is supervised by Polish Supervision Authority.