

In this article you will learn:
- What is technical analysis
- Basic tools of technical analysis
- Practical applications of technical analysis
Investors most often make trades based on either technical or fundamental analysis. Technical analysis is a trading discipline employed to evaluate investments and identify trading opportunities by analysing statistical trends gathered from trading activity, such as price movement and volume. That proper preparation for investing and analysis of the market situation is a necessary element to start investing in the financial markets.
What is Technical Analysis?
Technical analysis is a widely recognised method of chart analysis aimed at forecasting future prices of stocks, currencies or commodities. How is it different from fundamental analysis? Both approaches differ in virtually all aspects.
Fundamental analysis is not the simplest one because, for example, in the case of a company listed on the stock exchange, it includes information about the global, macroeconomic, regional and industry environment, as well as reports published by the company.
However, when using technical analysis, we are only interested in the movement of the price; how it has behaved in the past. Thanks to this information, we are able to determine the likely future movement of the company's price, currency or other financial assets.
Technical analysis is based on 3 main principles:
- the market discounts everything - the current market price takes into account all available information about a given security, the micro and macroeconomic situation as well as political and economic conditions.
- prices move in a trend - prices follow specific trends (upward, downward, horizontal) until there are clear signals indicating a trend reversal.
- history repeats itself - technical analysis focuses on predicting future price movements based on history; this assumption is based on the repetition of certain patterns over time.
Types of charts
When analysing the charts of individual financial instruments, investors most often deal with three types of charts - line, bar and candlestick.
The line chart is the most basic tool for presenting price movements. It contains the least information, but is the most readable one. It is most often used when analysing long-term trends.
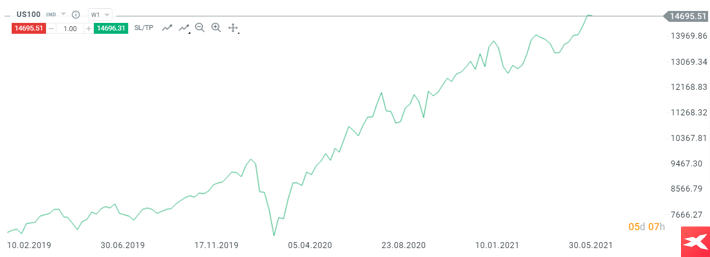 Source: xStation5
It should be remembered that information and research based on historical data or results do not guarantee the achievement of similar results in the future.
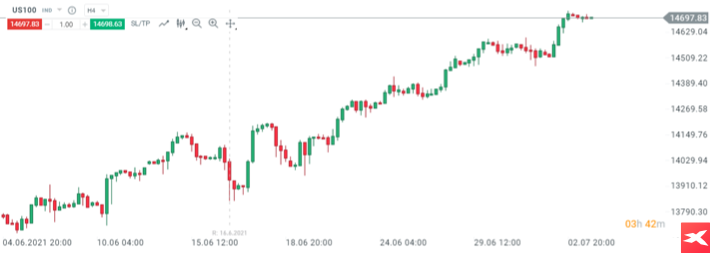
Bar and candlestick charts contain much more information than a line chart. Both the bars and the candles show the opening price of a given interval, the closing price, as well as the range of price fluctuations that took place at a specific time. For this reason, bar and candlestick charts are most often used to conduct technical analysis.
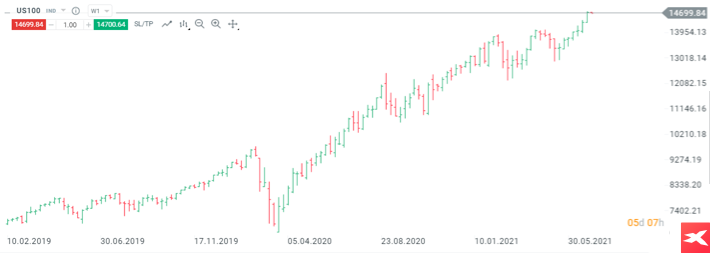 Bar chart example. Source: xStation5
It should be remembered that information and research based on historical data or results do not guarantee the achievement of similar results in the future.
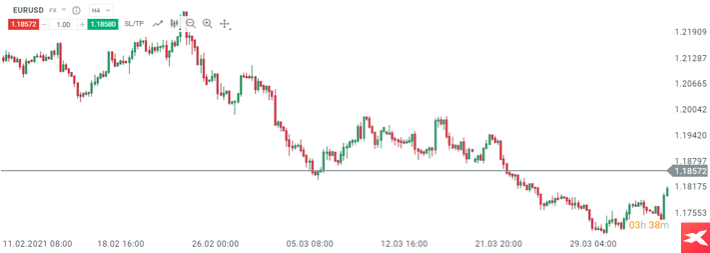
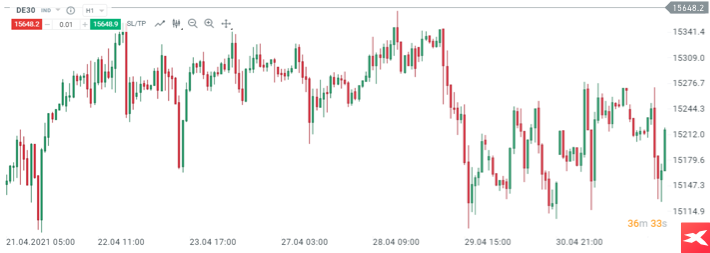
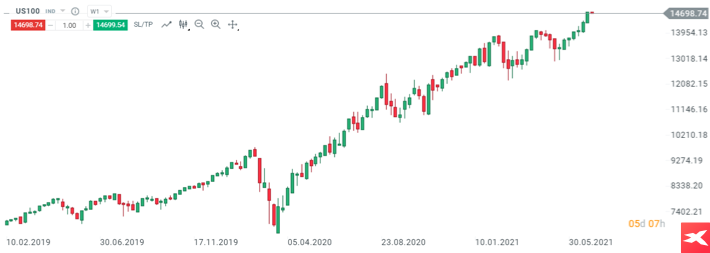 Candlestick chart. Source: xStation5
It should be remembered that information and research based on historical data or results do not guarantee the achievement of similar results in the future.
Trend
The definition of a trend can be explained in the simplest terms that it is a general direction in which something is developing or changing.
- if buyers have an advantage, we are dealing with an upward trend
- if the sellers have an advantage, we are dealing with a downward trend
- If the market forces balance each other, the sideways trend applies
An uptrend is in place when the chart shows a sequence of higher highs and higher lows.
 Source: xStation5
It should be remembered that information and research based on historical data or results do not guarantee the achievement of similar results in the future.
A downtrend prevails when the chart shows a sequence of lower highs and lower lows.
 Source: xStation5
It should be remembered that information and research based on historical data or results do not guarantee the achievement of similar results in the future.
We are dealing with a horizontal trend when there is no clear sequence on the chart, the price moves up and down, remaining within the trading range.
 Source: xStation5
It should be remembered that information and research based on historical data or results do not guarantee the achievement of similar results in the future.
Basic tools of technical analysis
Using a few basic principles and tools, anyone can learn technical analysis and then use this knowledge to make more informed investment decisions. Familiarising yourself with the meaning of the below terms can be an important first step.
Candlestick formations
Candlestick formations are divided into trend reversal and continuation patterns. They allow you to find turning points in the market or give a signal of trend continuation. Candlestick patterns are often used as an aid to both short-term and long-term market analysis.
The most popular trend continuation formations:
Falling / rising three methods patterns
Rising three methods pattern - a tall green candle forms in an uptrend. The high candle is followed by a group of small-bodied candles that indicate that there is some resistance in the current trend. These candles are generally red in color, but most importantly, all their bodies are within the swing range of the first tall green candle, and the shadows are also within the swing range. The opening of the last candle (usually the fifth in a row) is above the closing level of the previous correction day, and it closes at a new, maximum level.
 Source: xStation5
It should be remembered that information and research based on historical data or results do not guarantee the achievement of similar results in the future.
Falling three methods pattern - there is a downtrend in the market which is reflected in the formation of a high red candle. During the next three sessions, candles with low bodies are formed, which are oriented in the opposite direction to the current trend. It is best if the candle bodies of the correction period are green. The bodies of all these candlesticks remain within the range of the first red candlestick. The opening of the next and last candle of this formation should take place near the closing level of the previous session, and it's closing at a new, minimum level.
 Source: xStation5
It should be remembered that information and research based on historical data or results do not guarantee the achievement of similar results in the future.
The most popular trend reversal formations:
- Bullish / bearish engulfing pattern
- Hammer
- Shooting star
- Morning / evening star
A bullish / bearish engulfing pattern
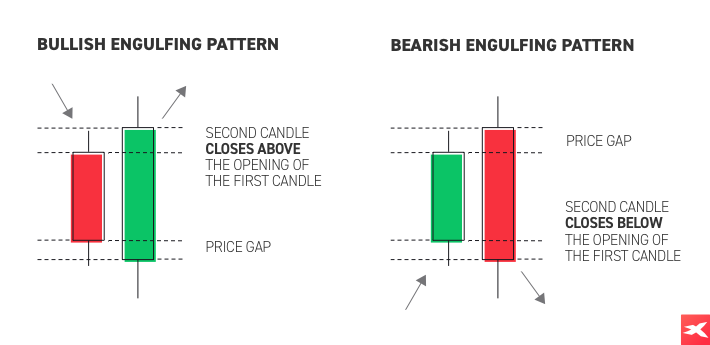 Source: xStation
Shooting star formation
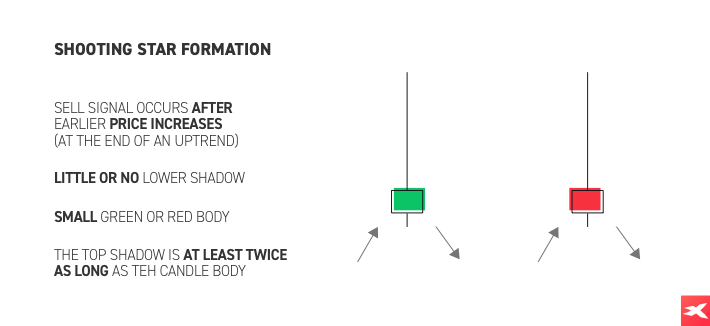 Source: xStation
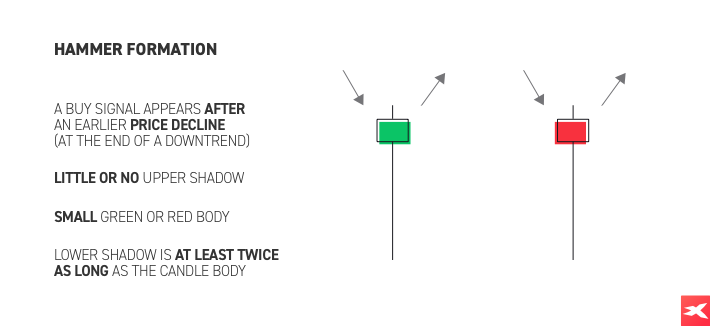
Hammer formation
 Source: xStation
Candlestick patterns - practical examples
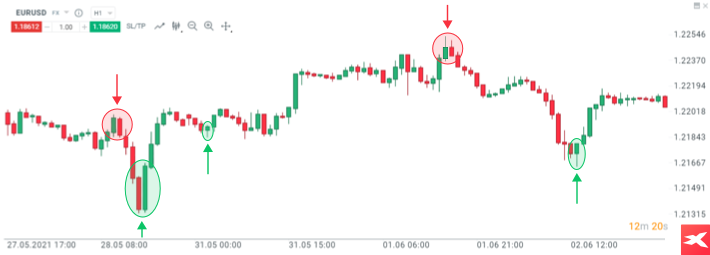
In the chart below, one can observe some examples of the above-described candlestick patterns. The first green circle is a bullish engulfing pattern, and the second green circle is a bullish hammer formation. The first red circle shows the bearish engulfing pattern, while the second one is the shooting star formation.
 Source: xStation5
It should be remembered that information and research based on historical data or results do not guarantee the achievement of similar results in the future.
Price Formations
Price formations are specific patterns that can be seen on the chart over any time frame. They allow the identification of turning points in the market or confirmation of the continuation of the price movement. Additionally, they can be used to determine the minimum range of price movement after confirmation of a given pattern.
The most popular trend continuation patterns:
The most popular price patterns:
- Flag
- Triangle
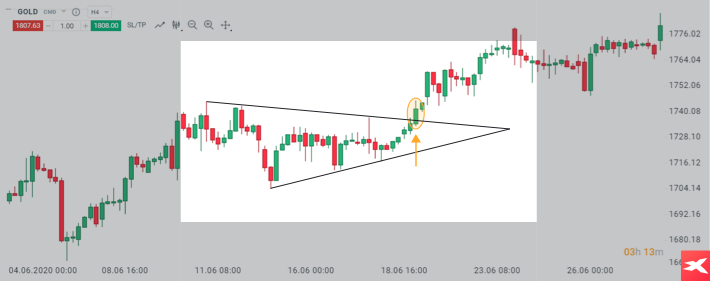
An example of a triangle formation
 Source: xStation5
It should be remembered that information and research based on historical data or results do not guarantee the achievement of similar results in the future.
The most popular trend reversal patterns are:
- Double top
- Double bottom
- Head and shoulders
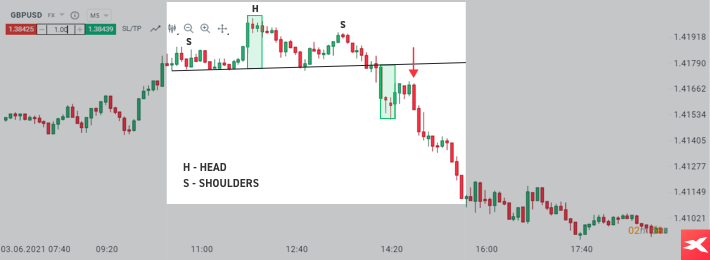
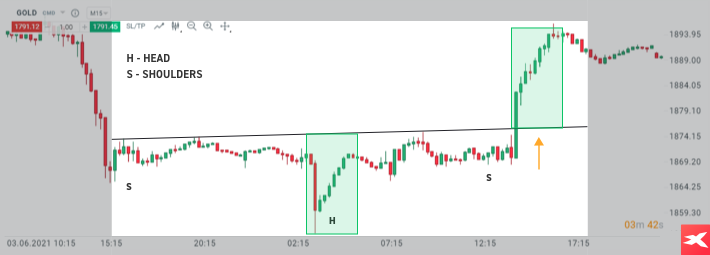
An example of a head and shoulders formation
 Source: xStation5
It should be remembered that information and research based on historical data or results do not guarantee the achievement of similar results in the future.
An example of a double bottom formation
 Source: xStation5
It should be remembered that information and research based on historical data or results do not guarantee the achievement of similar results in the future.
Moving Average
Another frequently used technical analysis tool is the moving average. It is one of the simpler indicators, but often generates very good signals. Nevertheless, it requires an appropriate setting of the main parameter. For example, when there is a strong trend in the market, a short-term average will work better. According to the main rule, as long as the price sits above the average, one should expect the price to continue to rise. On the other hand, if the price remains below the average, then the downward trend prevails. In the example below, the price bounced off the average and the upward trend continued.
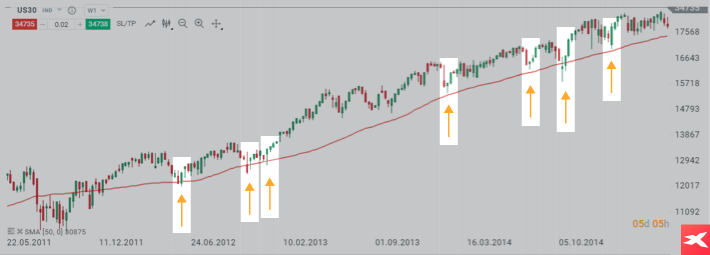 Source: xStation5
It should be remembered that information and research based on historical data or results do not guarantee the achievement of similar results in the future.
Trend line
The trendline is one of the simplest technical analysis tools. The example below shows an uptrend, with the trendline tracing the local lows. As a rule of thumb, as long as the price respects the line, one should expect the uptrend to continue. However, a break lower (red arrow) may herald a potential change in the trend.
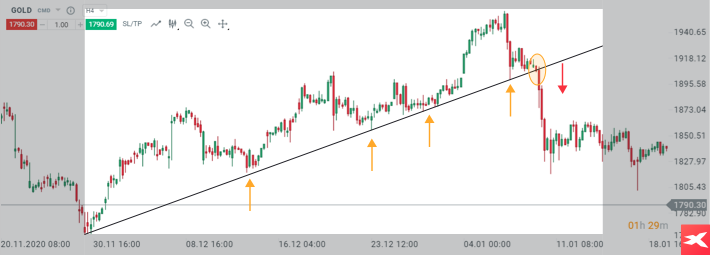 Source: xStation5
It should be remembered that information and research based on historical data or results do not guarantee the achievement of similar results in the future.
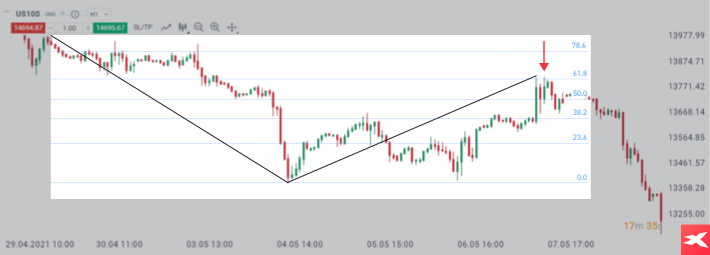
Fibonacci retracements
Using Fibonacci tools, one can measure the range of individual impulses and corrections. Fibonacci retracement levels are horizontal lines that indicate the possible support and resistance levels where price could potentially reverse direction. In the example below, a downward impulse was measured. The correction move first tested the 38.2% retracement, before moving lower to the 61.8% retracement. At this point, downward momentum faded away and price returned to the main downtrend.
 Source: xStation5
It should be remembered that information and research based on historical data or results do not guarantee the achievement of similar results in the future.
Market geometry - 1:1 structure
Another method of chart analysis is the so-called market geometry. It often happens that downward corrections as well as upward impulses in a given trend are of the same or very similar range. Geometry can therefore be used to join the prevailing trend after the correction, or to book profits in a potential turning point.
Example - joining the current trend
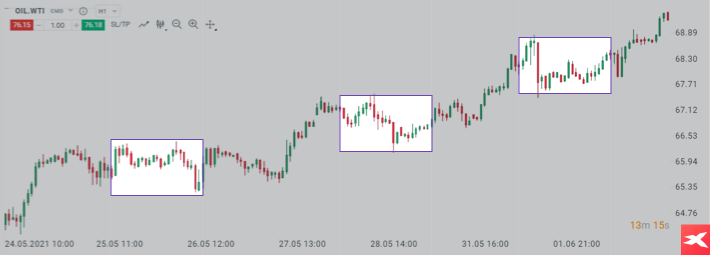
The example below shows that the price has been respecting the scope of the first downward correction for a long time. Each time the lower limit of the 1: 1 structure was tested (the purple rectangle), there was a rebound and the price hit a new local high.
 Source: xStation5
It should be remembered that information and research based on historical data or results do not guarantee the achievement of similar results in the future.
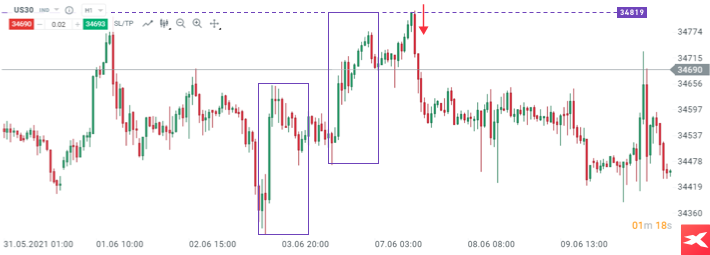
If we have long (buy) positions in our portfolio and the market reacts to the upper limit of the 1:1 structure resulting from the previous upward impulse, then this level may be used to book profits or partial closing of the position. Often local extremes can be determined with the help of geometry, which is especially useful in intraday trading.
 Source: xStation5
It should be remembered that information and research based on historical data or results do not guarantee the achievement of similar results in the future.
Support / resistance zones
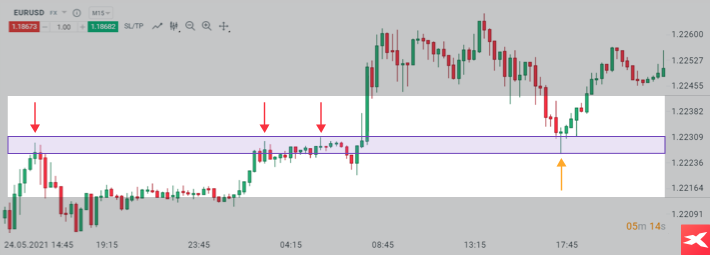
Support and resistance zones are simply horizontal zones marked by the previous price reactions. In case of an uptrend - breaking above the recent high results in creation of a reaction zone, which can then be used as support. In this case, the principle of polarity reversal takes place - after negating the level of resistance, it should be treated as support.
 Source: xStation5
It should be remembered that information and research based on historical data or results do not guarantee the achievement of similar results in the future.
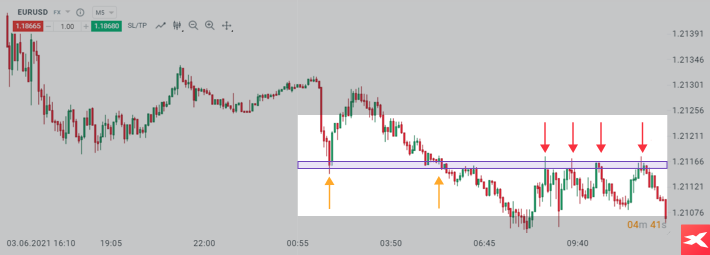
We are dealing with a similar situation in a downward trend as well. In the event that the price breaks below the recent low (local low), then this level should act as a resistance in the future. This is shown in the example below.
 Source: xStation5
It should be remembered that information and research based on historical data or results do not guarantee the achievement of similar results in the future.
Summary
Technical analysis is a good method of analysing the market, but investors must remember that no technical indicator is perfect. Neither one gives 100% accurate signals all the time. Traders should take into account that the signals from the indicators they choose can sometimes be misleading. However, a well-done technical analysis can assist you with your trading. Despite the clear advantages, investors must bear in mind that technical analysis is not free from defects and limitations. This is due to the fact that this type of analysis is based only on historical data, i.e. what has already happened, and never gives certainty as to how the market will behave in the future. On some occasions you can get mixed signals, two different indicators will shoot contradictory information; meaning one indicator could show a Buy signal while the other one would be showing a Sell signal. This could potentially cause confusion in trading decisions. In addition, technical analysis does not take into account various unexpected market events or key information that will be made public and may have a large impact on the prevailing trend. Therefore, traders should spend some time and effort thinking about how best to handle things if the market turns against them.