
The EURUSD is down more than 0.2% today, falling from its multi-year high near 1.192 to 1.176. This move pushed the RSI indicator down to 34, signaling oversold conditions. Looking at the technical setup of the pair, we can see that a similar 1:1 impulse was triggered between late August and early September, followed by two smaller but also symmetrical corrections.
The price has dropped below two key exponential moving averages — the EMA50 and EMA200 (orange and red lines). The decline in the pair has been driven by relatively strong recent U.S. economic data, particularly from the labor market. Yesterday, weekly jobless claims fell by nearly 30,000, marking the sharpest drop since 2021, easing fears of recession and further labor market weakness. Today, the U.S. dollar is also gaining more than 0.2%.
EURUSD (H1 Interval)
The key task for the pair will be to climb back above the EMA200 (red line), which could signal a bullish impulse. On the other hand, a decline below 1.17 could undermine the ongoing upward trend and increase the likelihood of a larger correction following record gains.
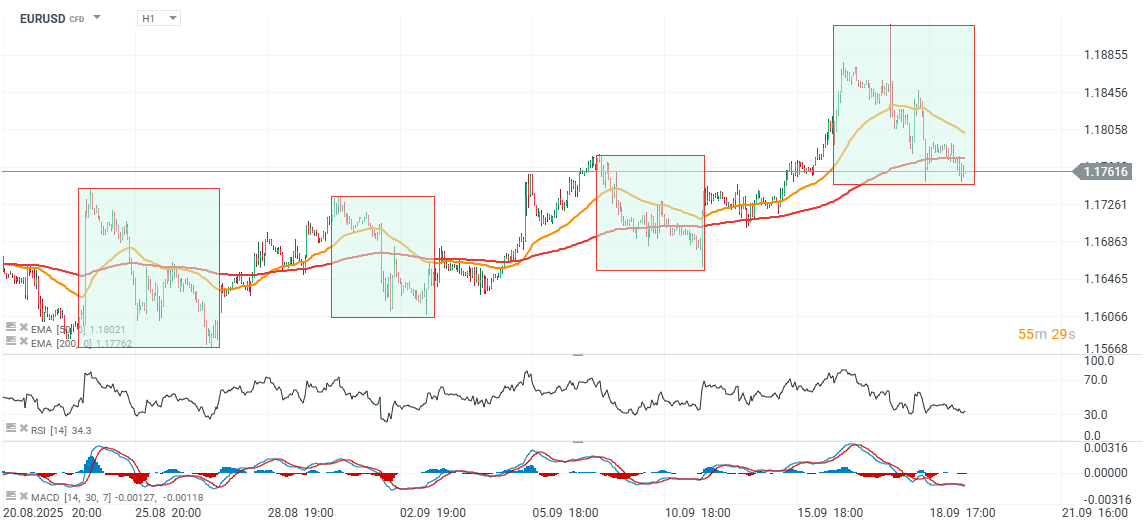
Source: xStation5

Cocoa loses 5% amid rising inventories on ICE

Oil gains 3% amid US - Iran escalation and supply disruption on the Black Sea

🔼 Gold gains 1.7%

🛢️Brent Crude Oil Tests $95 per Barrel