- Revenues: $4.52 billion vs. $4.51 billion exp. (up 4.9% y/y)
- Earnings per share (EPS): $10.91 vs. $8.20 exp. ($9.55 in Q3 2022)
- Assets under management (AUM): $9.1 trillion vs. $9.23 trillion exp. (14% increase y/y)
- Net capital inflows: $2.57 billion vs. $61.74 billion exp. (down 85% y/y)
- Operating margin :36.2% vs. 35.8% exp. and 35.4% in Q3 2022
- Costs: $2.8 billion (in line with expectations (up 3.6% y/y)
- Equity market fund inflows: $34.47 billion in outflows vs. $11.46 billion inflows exp.
- Long-term funds inflows: $12.64 billion in outflows vs. $50 billion inflows exp.
- Inflows to fixed income funds: $13.21 billion vs. $23.33 billion exp.
- Technology services revenue: $407 million vs. $365 million exp. (20% y/y increase)
Higher yields a threat to BlackRock's core business?
In a commentary on the results, CEO Larry Fink pointed out that investors now have 'real' opportunities to earn satisfactory returns outside of the stock market and risk assets. We see this influencing the behavior of BlakcRock's clients, who can now 'wait out' potentially tougher times outside the equity market by using money market funds before monetary policy normalizes, once again creating a climate conducive to 'risk appetite' - which has helped the fund for the past 20+ years. At the same time, we see that BlackRock's performance with 'fixed income' - has not mitigated the weakness seen with equity market funds and has severely disappointed market expectations. Clients are moving funds not only within the assets managed by the fund but also outside of it, which may negatively affect the 'shrinking' business. On the other hand, the company strongly improved net income, with a slight increase in expenses y/y.
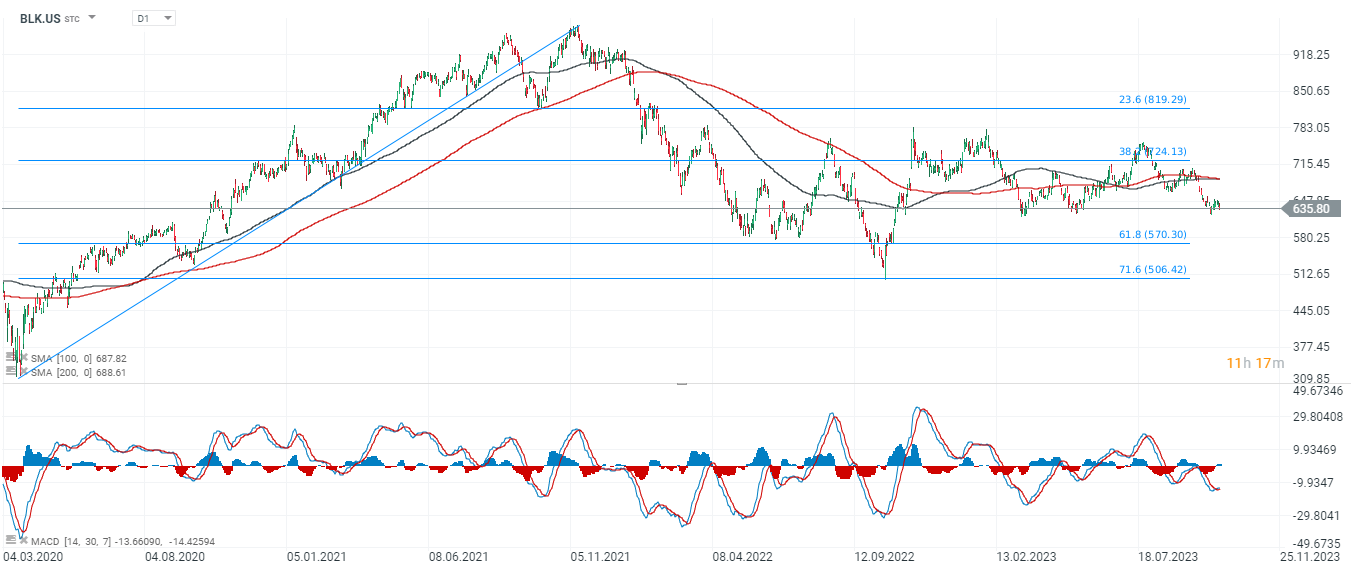
BlackRock (BLK.US, D1) chart.
Looking at the chart, we can see that the price has failed to hold above the 38.2 Fibonacci retracement of the March 2020 upward wave, and now a possible scenario is a test of 61.8 at $570 and 71.6 where we see the level from last autumn's oversold lows at $500 per share. At the same time we can see forming a bullish crossover of the averages on the MACD, which could potentially signal an upcoming 'non-intuitive' upward market reaction.

Source: xStation5

Palo Alto acquires CyberArk. A new leader in cybersecurity!

US OPEN: Blowout Payrolls Signal Slower Path for Rate Cuts?

Market wrap: Oil gains amid US - Iran tensions 📈 European indices muted before US NFP report

Economic calendar: NFP data and US oil inventory report 💡


