


- Volatility refers to the amount of uncertainty, risk and fluctuations that occur on the market and, most often, to the amount of price changes over a given period on the financial markets.
- It’s a statistical measure of the dispersion of returns for any given instrument.
- There are two types of volatility: historical and expected.
- Traders tend to follow the Volatility Index (VIX), which can be considered to be a gauge of fear or pessimism in the market place.
During high market volatility, prices tend to be very dynamic, and change rapidly over a short time period. When markets are not volatile or ‘fixed’ market movements and trends are created much more steadily. Volatility may appear in the market after a significant reading of macroeconomic data or after unexpected events, such as a natural disaster or a significant political event.
More experienced traders tend to invest during greater volatility, trying to open and close positions in a very short time.
Volatility in Action
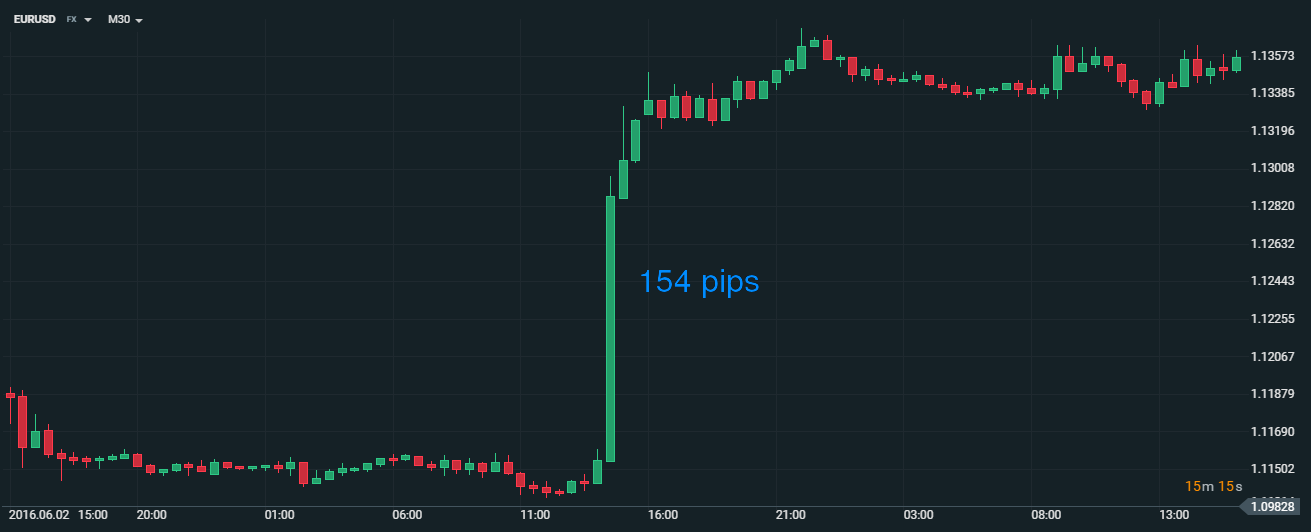
Source: xStation
The chart above is a great example of both low and high volatility. This usually occurs before a significant macroeconomic reading, where traders are awaiting the outcome of the reading. After the reading is published, strong or significant movement can develop rapidly - as seen on the EURUSD chart above. This particular example occurred after the publication of the US non-farm payrolls, which came in vastly different to market expectations. It’s also interesting to note that once the initial reaction from the reading subsided, the market lost its volatility and returned to range-bound trading.
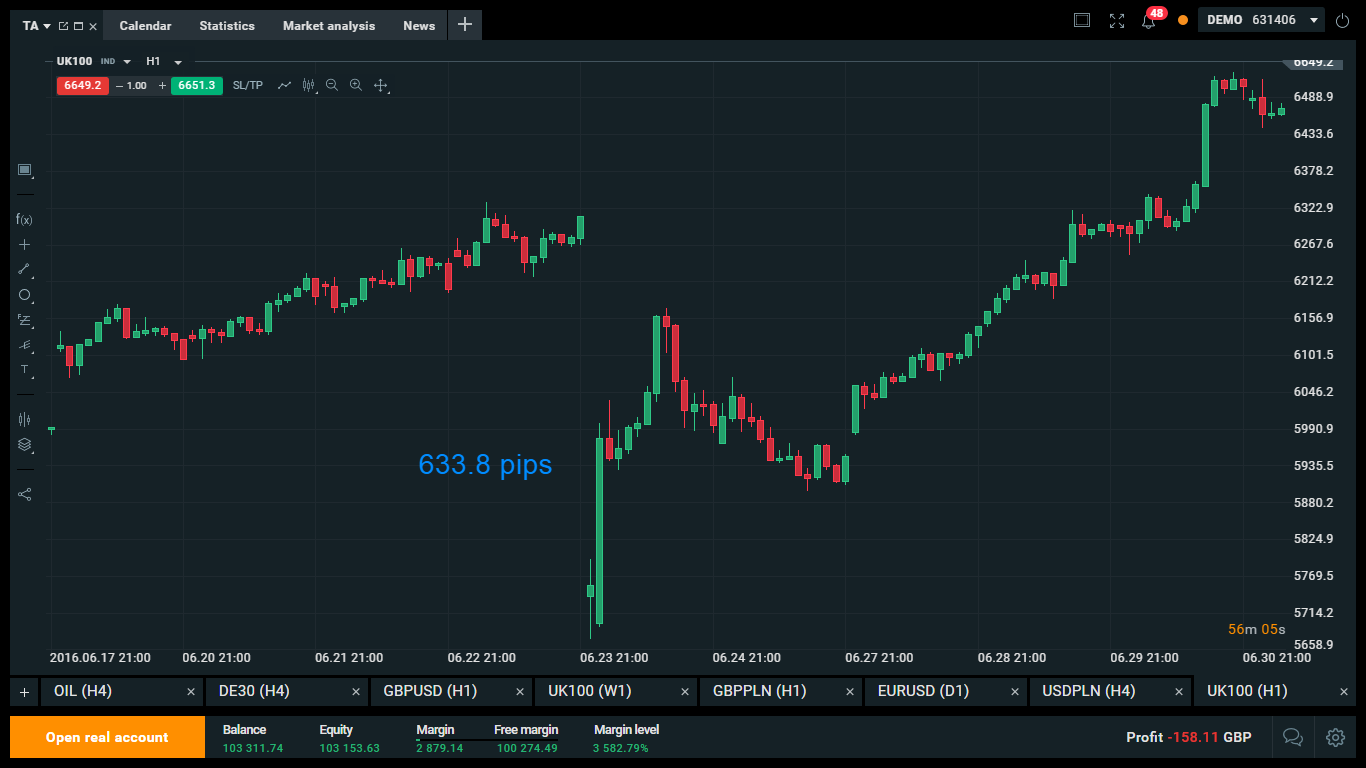
Source: xStation
The example above shows the result of a UK referendum, where the UK100 chart fell by more than 600 pips in less than an hour. We can see a significant increase in risk aversion in the short term.
Volatility Index
The Volatility Index, known traditionally as the VIX, is a weighted index of implied volatility in options contracts on the US S&P 500 index. In effect, it’s a gauge of fear or pessimism in the market of 500 large capitalisation US stocks listed in the US, and as such a barometer of general market confidence and risk appetite.
Historically, the VIX Index is inversely correlated with US stock markets. The lower the VIX has been, the more stable market confidence is and stocks have rallied. Equally, the higher the VIX has been, the more volatile the stock markets have been and suffered price falls.
The xStation chart below tracks the VIX index against the US30 (underlying Dow Jones Index) and it's here you can see the inverse correlation between the two indices strongly.
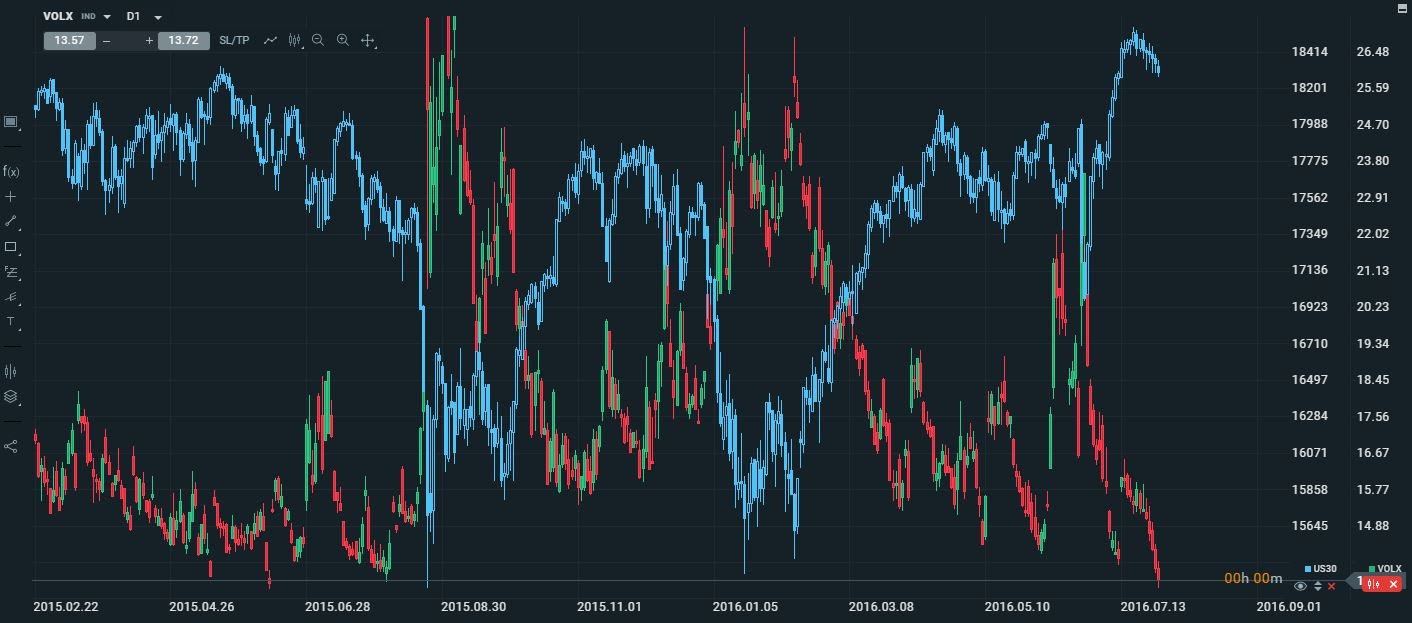
Source: xStation