

- South Korea's KOSPI index dropped by up to 7.4% due to a heavy sell-off in memory stocks Samsung Electronics and SK Hynix.
- ChangXin Memory Technologies reported a technological breakthrough in DRAM chip architecture and server memory samples.
- Direct competitors Micron and SanDisk fell in response, while broader Nasdaq indexes saw limited sectoral rotation.
- The Nasdaq 100 contract remains in an intact uptrend while consolidating above key moving averages near 30,700 pts.

- South Korea's KOSPI index dropped by up to 7.4% due to a heavy sell-off in memory stocks Samsung Electronics and SK Hynix.
- ChangXin Memory Technologies reported a technological breakthrough in DRAM chip architecture and server memory samples.
- Direct competitors Micron and SanDisk fell in response, while broader Nasdaq indexes saw limited sectoral rotation.
- The Nasdaq 100 contract remains in an intact uptrend while consolidating above key moving averages near 30,700 pts.
Could the KOSPI crash drag down Nasdaq?
Tuesday's session in Seoul was a real earthquake: KOSPI dropped by up to 7.4% to 5,914 pts. The drops were so sharp that the sidecar mechanism was activated, aimed at mitigating steeper declines after crossing a 5% change threshold. The culprit is the memory sector, which accounts for a massive part of the entire index, namely Samsung Electronics (-7.7%) and SK Hynix (-8.8%). Since both companies together hold over 50% of the index, their heavy sell-off fully dictates the index's behavior.
What actually spooked the market?
China's ChangXin Memory Technologies (CXMT) reported a breakthrough in DRAM chip architecture (4F² design), which could increase memory density by 30–50%. The company announced the shipment of HBM server memory samples later this year, a premium segment where Samsung, SK Hynix, and Micron previously shared a virtual monopoly.
This is not the first such episode. An identical panic (a drop in KOSPI of over 8%) occurred in July during CXMT's debut on the Shanghai Stock Exchange. The market is thus reacting more to the narrative of monopoly erosion than to hard data: The Korea Times notes that CXMT still faces challenges in stabilizing yields for HBM, while Samsung and SK Hynix are already testing the newer generation HBM4E. DRAM market shares (Counterpoint, Q1): Samsung 38%, SK Hynix 29%, Micron 22%, CXMT ~8%. The technological advantage remains significant.
Spillover to Wall Street. Is this a systemic risk?
Spillover signals are already visible, but they are selective, not systemic:
- Micron (-3.9% on Monday) and SanDisk (-6%) reacted directly. This is natural, as they are direct competitors to CXMT in the same memory segment.
- Nvidia (-1.3%), AMD (-2.3%), and Broadcom (-1.9%) fell significantly less. This is an important distinction: Nvidia and AMD are logic/GPU designers, not DRAM/NAND memory manufacturers. CXMT is not their direct competitor. Granted, they are customers of Samsung/SK Hynix/Micron (HBM memory is a key component of AI chips), so cheaper, more accessible memory from a Chinese supplier could in theory even lower production costs for GPUs in the longer term, which is not unequivocally bearish for Nvidia.
- The Nasdaq Composite fell -0.4% on Monday, S&P 500 -0.1%, and the Dow even rose +0.4% — this is certainly not panic scale, but rather a sectoral rotation at the expense of memory manufacturers. Today, futures continue to sell off, however.
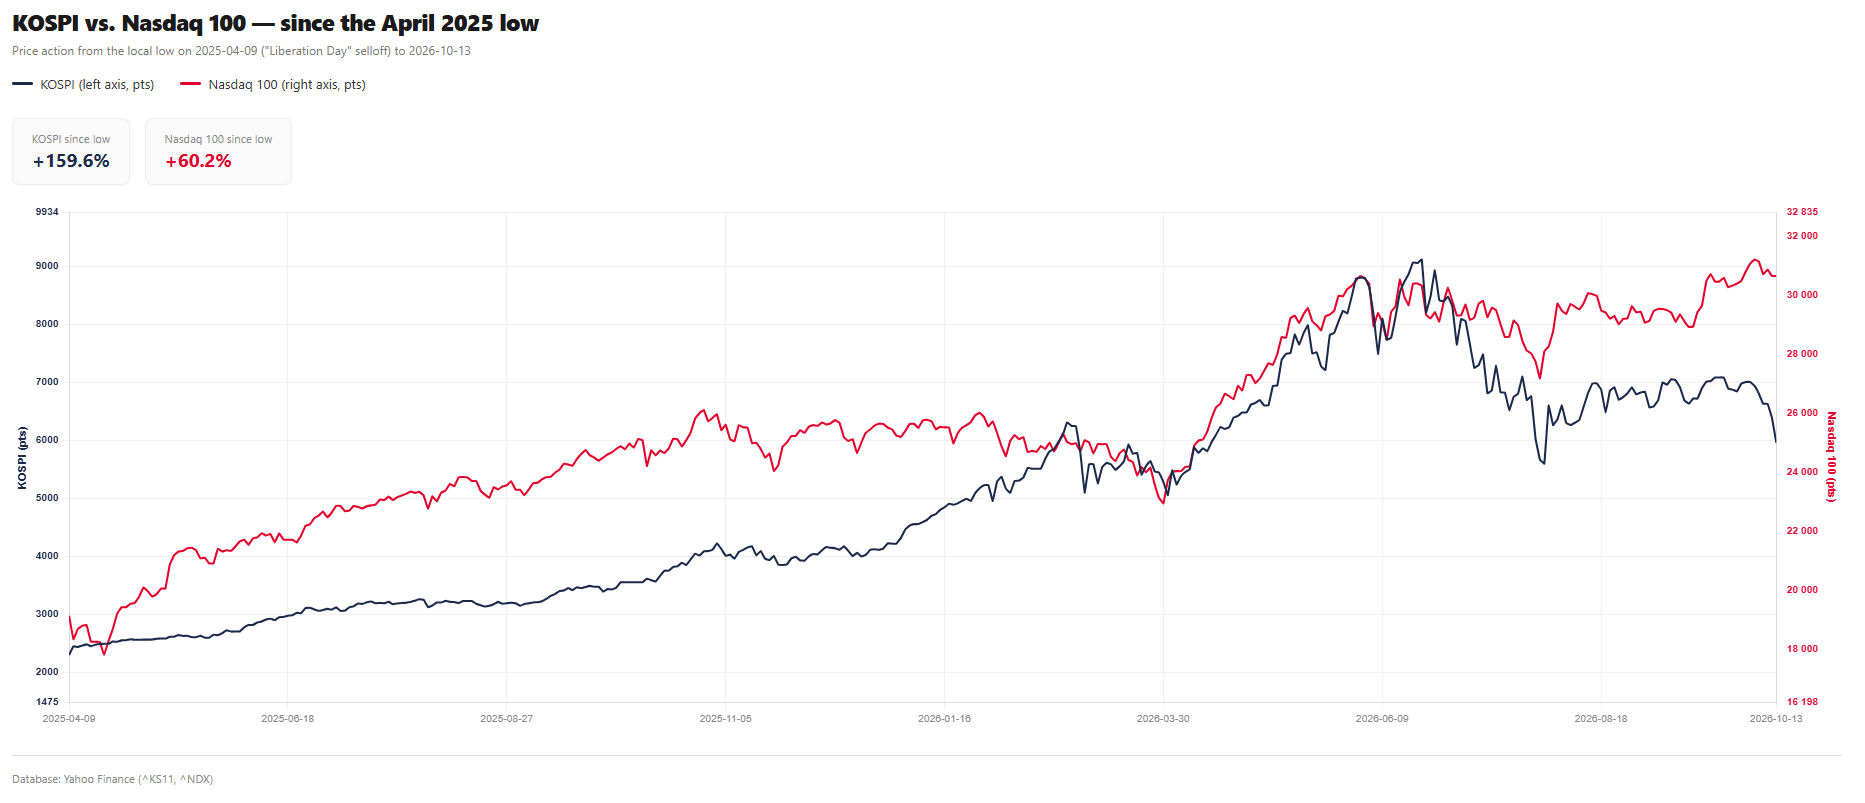 The correlation is significant, but we currently see a decoupling of Nasdaq from KOSPI. Although Nasdaq is concentrated, there is still diversification across different types of tech companies. Source: Yahoo Finance, XTB
Broader Context: It's Not Just CXMT
A broader weight on the Nasdaq is also being placed by:
- Disappointment over OpenAI revenue (weighing on Oracle, Nvidia, AMD last week),
- Rising bond yields (10-year and 30-year at 24-year highs),
- Geopolitical escalation (Middle East, crude oil near 105 USD/bbl Brent),
- General concerns about an "AI bubble" alongside extremely low market breadth (implied NDX correlation in the 25th percentile of the 3-year range, pointing to a poorly diversified rally susceptible to sudden reversals on a single negative catalyst).
Conclusion
KOSPI is primarily a mirror of concentration risk in two memory stocks, rather than a universal leading indicator for the entire US tech sector. Real spillover risk exists mainly for Micron and SanDisk (direct competitors in DRAM/NAND). Here, the sell-off is fundamentally justified and could deepen if CXMT confirms progress in HBM. For Nvidia, AMD, and the broader Nasdaq 100, the risk is indirect and diluted: any potential impact on memory component prices is neutral to positive for GPU manufacturers' margins, rather than directly negative.
Considering that US100 continues to hold key technical supports (29,400–30,000) and remains in an intact uptrend, the recent news from Korea looks more like a trigger for sectoral rotation and profit-taking in a narrow group of memory stocks, rather than a harbinger of a broader index correction — unless it aligns with another negative macro catalyst (weak bank earnings, inflation surprise on Thursday/Friday, or escalation in the Middle East).
US100 Technical Analysis
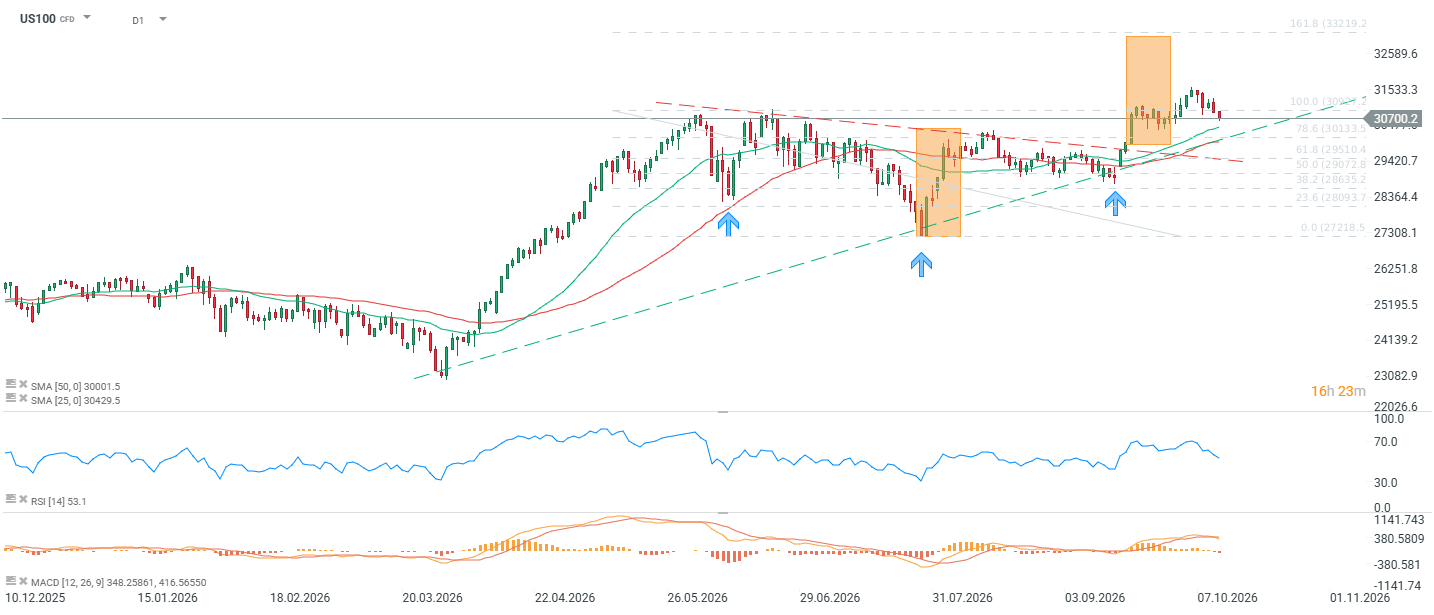
The Nasdaq 100 contract (US100) is currently trading around 30,700 pts, having pulled back in recent days from all-time highs set just above 32,600 pts. The daily chart structure shows a clear uptrend ongoing since the April low (~22,400 pts), guided by two parallel support lines (dashed green) and capped from above by a descending resistance line (dashed red), which price broke in August.
Crucial is the August–September setup: the market underwent a correction to the 50.0–61.8% Fibonacci retracement zone (29,072–29,510 pts), where it was defended twice by buyers (highlighted by orange zones and blue accumulation arrows). This translated into a dynamic move to a new ATH near the 161.8% Fibonacci extension (33,219 pts).
Price pulled back from the top and is consolidating just above SMA25 (30,430) and SMA50 (30,002) — both moving averages are still rising and supporting the bullish structure. RSI(14) at 53 is neutral, without being overbought, giving room for movement in either direction. MACD shows a weakening but still positive histogram, signaling fading rather than reversing momentum.
As long as price holds above 29,400–29,500, the upward structure remains intact. A breakdown below this zone would open the door to a deeper correction toward 28,000–28,400.



Morning Wrap: Tech Crash in Asia and Hawkish Central Banks in the Shadow of an Oil Shock (13.10.2026)


Morning Wrap: Oil cheaper despite attacks on Saudi Arabia, markets await CPI (12.10.2026)



Daily Summary: A Shallow Rebound Ahead of Earnings Season


Lumentum: Demand for AI infrastructure exceeds capacity
The content of this report has been created by XTB S.A., with its registered office in Warsaw, at Prosta 67, 00-838 Warsaw, Poland, (KRS number 0000217580) and supervised by Polish Supervision Authority ( No. DDM-M-4021-57-1/2005). This material is a marketing communication within the meaning of Art. 24 (3) of Directive 2014/65/EU of the European Parliament and of the Council of 15 May 2014 on markets in financial instruments and amending Directive 2002/92/EC and Directive 2011/61/EU (MiFID II). Marketing communication is not an investment recommendation or information recommending or suggesting an investment strategy within the meaning of Regulation (EU) No 596/2014 of the European Parliament and of the Council of 16 April 2014 on market abuse (market abuse regulation) and repealing Directive 2003/6/EC of the European Parliament and of the Council and Commission Directives 2003/124/EC, 2003/125/EC and 2004/72/EC and Commission Delegated Regulation (EU) 2016/958 of 9 March 2016 supplementing Regulation (EU) No 596/2014 of the European Parliament and of the Council with regard to regulatory technical standards for the technical arrangements for objective presentation of investment recommendations or other information recommending or suggesting an investment strategy and for disclosure of particular interests or indications of conflicts of interest or any other advice, including in the area of investment advisory, within the meaning of the Trading in Financial Instruments Act of 29 July 2005 (i.e. Journal of Laws 2019, item 875, as amended). The marketing communication is prepared with the highest diligence, objectivity, presents the facts known to the author on the date of preparation and is devoid of any evaluation elements. The marketing communication is prepared without considering the client’s needs, his individual financial situation and does not present any investment strategy in any way. The marketing communication does not constitute an offer of sale, offering, subscription, invitation to purchase, advertisement or promotion of any financial instruments. XTB S.A. is not liable for any client’s actions or omissions, in particular for the acquisition or disposal of financial instruments, undertaken on the basis of the information contained in this marketing communication. In the event that the marketing communication contains any information about any results regarding the financial instruments indicated therein, these do not constitute any guarantee or forecast regarding the future results.