
Chart analysis is the branch of technical analysis that takes into account only price quotes. It is the purest technical analysis available and only pays attention to past price movements to create a future approximation of asset prices. Chart analysis is often confused with technical analysis, however, technical analysis is a broader term that encompasses more concepts than simply reading the charts.
As we pointed out, chart analysis only pays attention to prices.
When making future forecasts, investors who base their inputs on chart analysis seek to detect figures and patterns of behavior that are repeated over time. We can classify these figures under two types:
Trend Continuation Figures
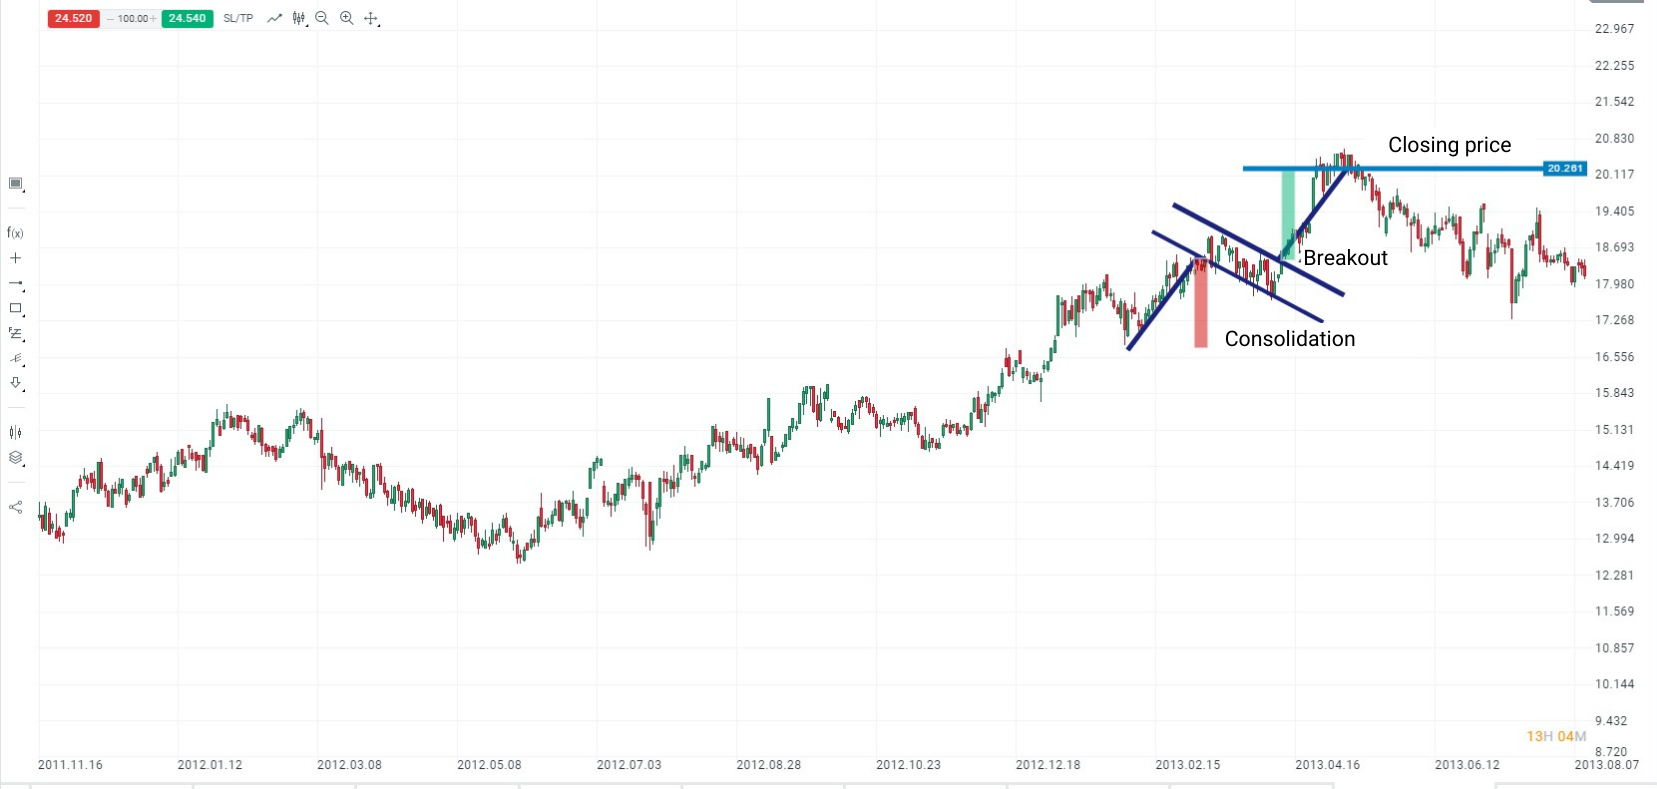
Trend continuation figures are those patterns that indicate the most likely scenario for the price to continue in the same direction that it has been showing in recent times. Therefore, if a continuation figure appears after a significant bullish run, the premises of the chart analysis warn us that the rises for the asset in question will surely continue. Also, a continuation figure in an environment of declines tells us that we must remain prepared to see more declines in prices. Here are some of the best known and most used trend continuation figures:
Rectangles - lateral formation whose break in favour of the main trend warns of a continuation of the same.
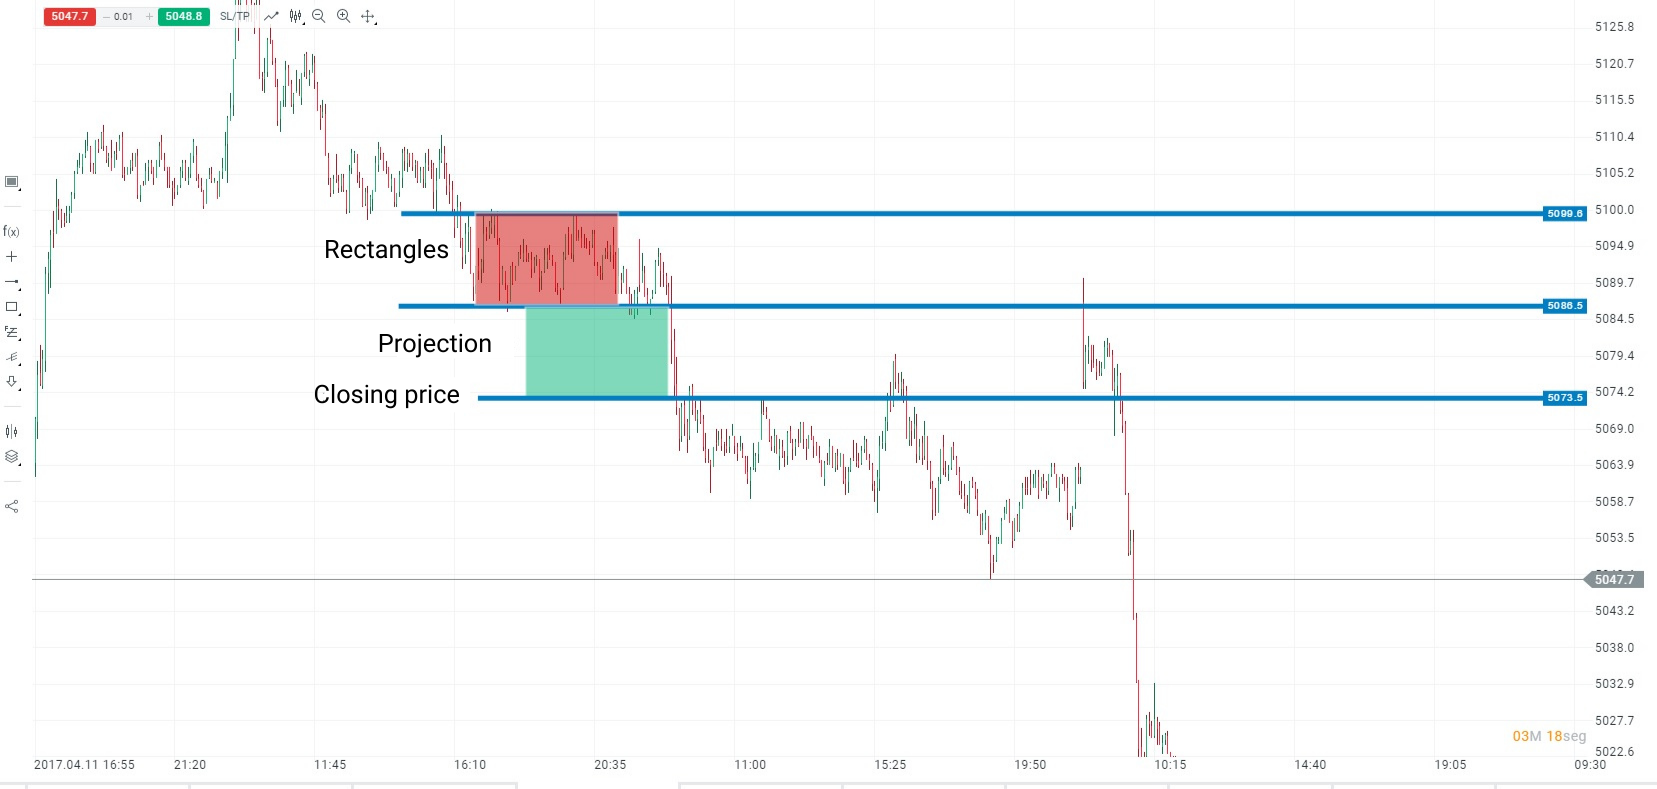
Source: xStation
Please be aware that the presented data refers to the past performance data and as such is not a reliable indicator of future performance.
Flags - side formation with slight bias against the main trend. The break in favour of the main trend anticipates a target equal to the previous run.
Source: xStation
Please be aware that the presented data refers to the past performance data and as such is not a reliable indicator of future performance.
Gaps - although there are many types of gaps, the most significant are those that occur in favour of the main trend and are a symptom of a continuation of the market sign.
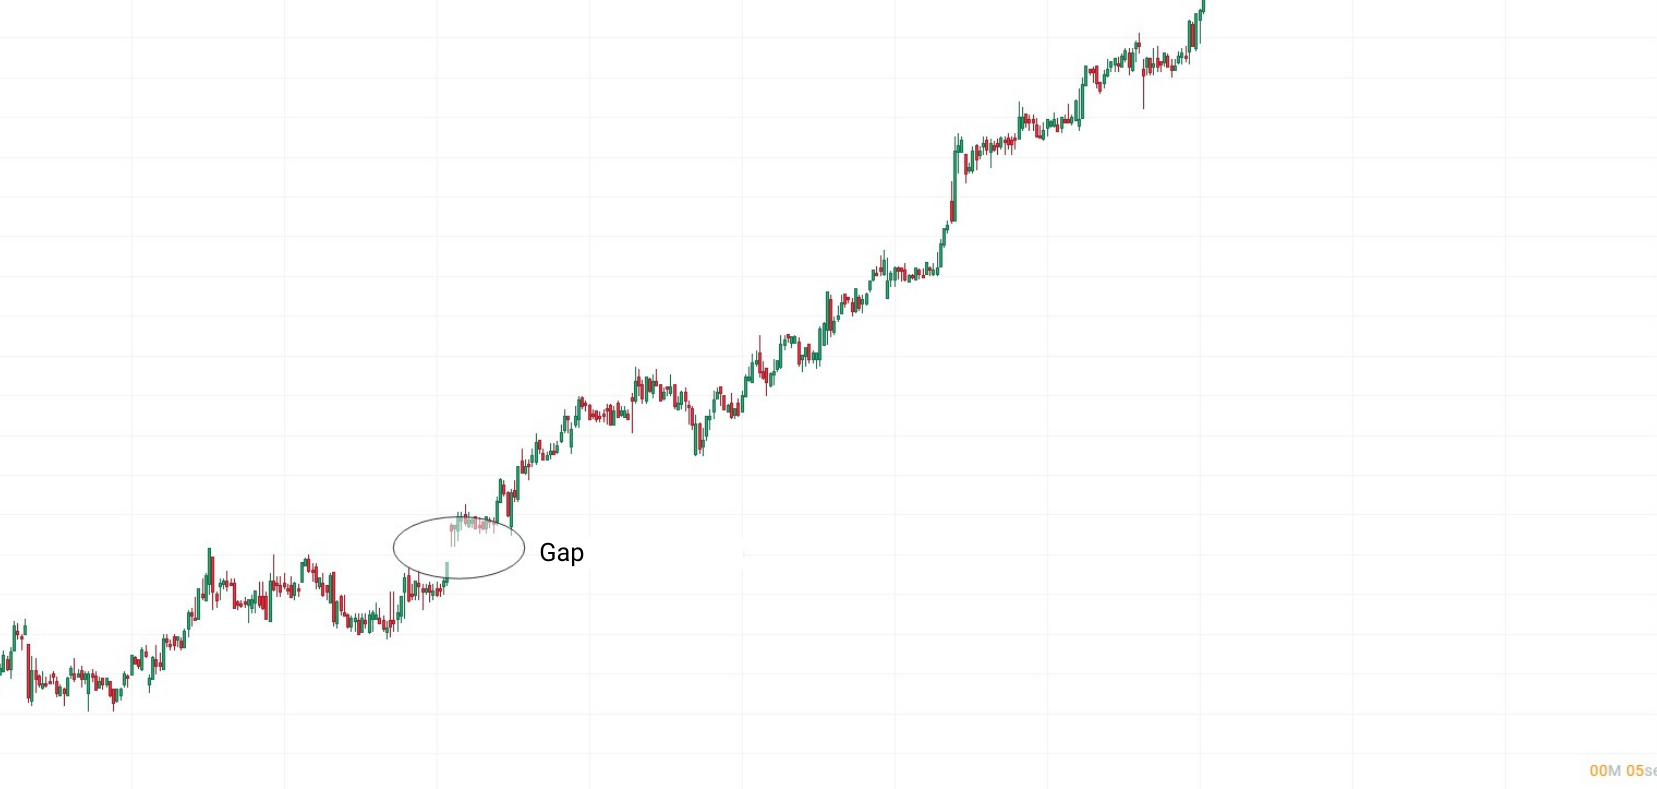 Source: xStation
Please be aware that the presented data refers to the past performance data and as such is not a reliable indicator of future performance.
Trend change figures - trend change figures are those formations that anticipate a possible turn in the evolution of a listed asset. In other words, a trend change figure after an upward trend warns us that the buying pressure is probably coming to an end and that falls will begin. In the same way, if a trend change figure appears in the middle of a downward journey, we must be vigilant, since there are high probabilities that the price has hit the bottom.
Below you can find some of the most popular trend reversal figures.
Shoulder Head Shoulder - after an evolution in favour of the trend, the impossibility of breaking a new high and the consequent breakage of the key or clavicular support, the hopes of a continuation of the trend are fading.

Source: xStation
Please be aware that the presented data refers to the past performance data and as such is not a reliable indicator of future performance.
Double Bottom - after a downtrend, exceeding a maximum between minimums anticipates capital inflows in the price.

Source: xStation
Please be aware that the presented data refers to the past performance data and as such is not a reliable indicator of future performance.
Double Top - after an uptrend, the drilling of a low between highs anticipates capital outflows in price.

Source: xStation
Please be aware that the presented data refers to the past performance data and as such is not a reliable indicator of future performance.


This content has been created by XTB S.A. This service is provided by XTB S.A., with its registered office in Warsaw, at Prosta 67, 00-838 Warsaw, Poland, entered in the register of entrepreneurs of the National Court Register (Krajowy Rejestr Sądowy) conducted by District Court for the Capital City of Warsaw, XII Commercial Division of the National Court Register under KRS number 0000217580, REGON number 015803782 and Tax Identification Number (NIP) 527-24-43-955, with the fully paid up share capital in the amount of PLN 5.869.181,75. XTB S.A. conducts brokerage activities on the basis of the license granted by Polish Securities and Exchange Commission on 8th November 2005 No. DDM-M-4021-57-1/2005 and is supervised by Polish Supervision Authority.