
The examples of classical chartist figures are repeated over and over again in time. Let's take a look at a few examples of one of the most followed patterns: Triangles.
Chart analysis is the part of technical analysis that studies price movements. Those figures that make up prices and that are repeated historically, is called chartism. Each figure has different connotations and serves to warn whether the dominant trend is going to continue or if there may be a change in it. In addition, most chart figures are used to set price targets.
Within the chart analysis one of the most common figures are the triangles. Triangles can be divided into several categories:
The symmetrical triangle, where the two main lines that form it, together with the base of it, have opposite tendencies. In other words, it is made up of a bullish and a bearish guideline. The movement of prices, as in all triangles except in the case of the expansive one, decreases little by little as it approaches the vertex. They suppose a fall in volatility until it finally breaks down some of its parts. These types of triangles can be broken in both directions, although the triangle is usually a figure of consolidation and continuity of the previous trend. The target on all triangles is activated by projecting the height of the triangle (the widest part of the triangle) from the break point.
The ascending triangle is made up of a horizontal resistance line and a bullish guideline; the price is making increasing lows within the triangle. These types of triangles are usually broken on the upside in most cases.
The descending triangle is formed by a horizontal line that works as a support and a bearish guideline, the price is making decreasing highs within the triangle. These types of triangles tend to break downward most of the time.
Expansive triangle is a type of a triangle where prices instead of decreasing are expanding, hence its name. They tend to appear more commonly within downtrends, since they involve an increase in volatility. They are the only triangles that do not provide any specific purpose.
Wedges are triangular figures, where the two lines have the same direction and have a clear particularity. The ascending wedge, (with the two bullish lines) has bearish implications and the descending wedge, (with the two bearish lines) has bullish implications.
Source: xStation
Please be aware that the presented data refers to the past performance data and as such is not a reliable indicator of future performance.
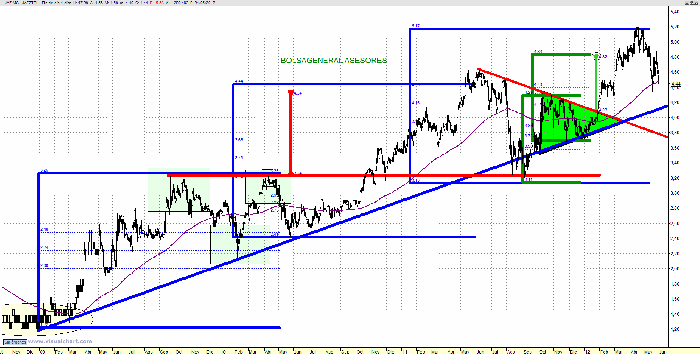
It is not difficult to find triangles in any market. In the case of Jazztel we can see a very clear triangular figure, (indicated in green), in this case symmetrical triangle, which we were talking about during the end of 2011 and whose objective of 20% increase.
Source: xStation
Please be aware that the presented data refers to the past performance data and as such is not a reliable indicator of future performance.
It was activated in January 2012 with a theoretical target of 4.82 euros, which was finally met.
Source: xStation
Please be aware that the presented data refers to the past performance data and as such is not a reliable indicator of future performance.
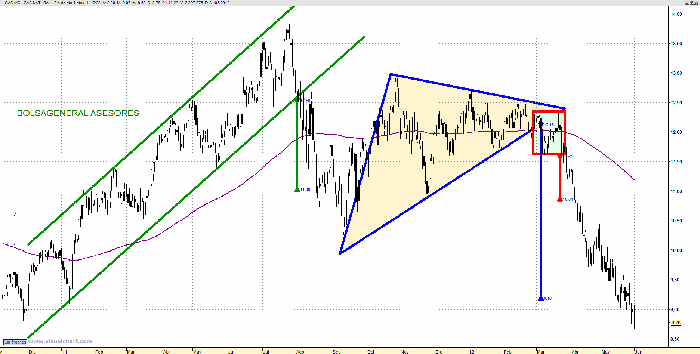
In the case of Gas Natural, we can see another clear triangular figure, another symmetrical triangle, (indicated in blue), with pullback included, once the bullish guideline of the triangle is broken goes from being support to being resistance, a figure discussed at the end of 2011 and at the beginning of this year, whose target of 9.16 euros was activated in the month of March and which was fulfilled during this month of May.
Source: xStation
Please be aware that the presented data refers to the past performance data and as such is not a reliable indicator of future performance.
Source: xStation
Please be aware that the presented data refers to the past performance data and as such is not a reliable indicator of future performance.
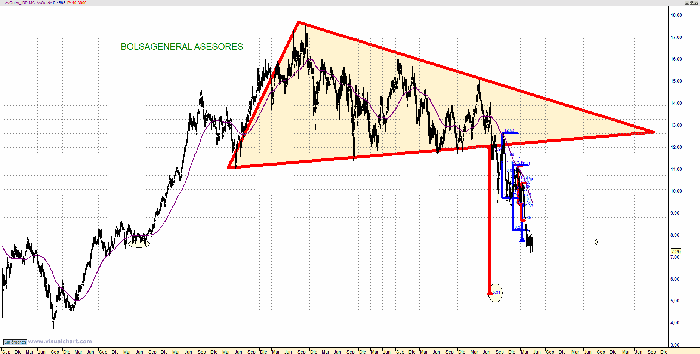
Although it is true that triangles are usually figures of continuation of the trend and that they are also usually figures that are formed during a not too long time, in the following Indra graph, we see how it is a descending triangle, which serves to change the trend of a security in the medium term.
Source: xStation
Please be aware that the presented data refers to the past performance data and as such is not a reliable indicator of future performance.
It is a gigantic triangle that we have been commenting on from the General Stock Exchange, since September 2011. By losing the 12 euros we have been insisting that everything indicates that Indra will fall towards 5.30 euros to meet the tremendous downward objective of this clear triangular figure, in this case a descending triangle, (indicated in red).
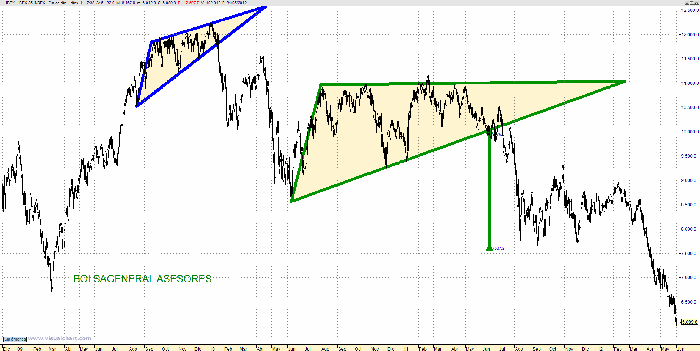
In the following example from Santander, we see two triangular figures. In the first place, an ascending wedge, with bearish implications, (indicated in red) that we discussed during the end of 2009 and that was activated in January 2010, causing the value to fall.
Later we can see a large triangular figure in Santander, in this case a descending triangle (indicated in blue) formed during much of 2010 and 2011 and whose ambitious downward objective would take the value towards levels of 3.56 euros approx. Little by little the courage walks towards the indicated objective.
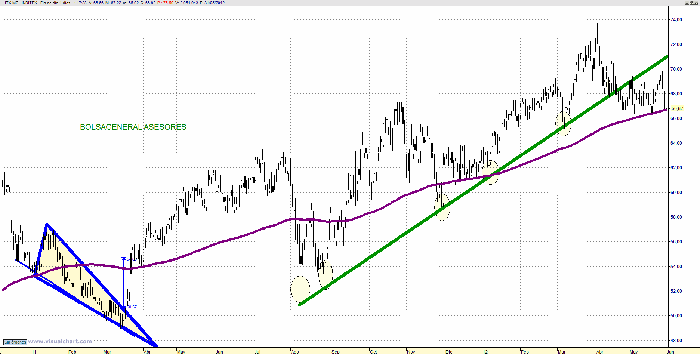
We have seen the example of an ascending wedge with bearish implications, now we will see the opposite case, a descending wedge with bullish implications that was formed in Inditex during the beginning of 2011 (which I indicate in blue) and whose target towards 54.68 euros is it delivered perfectly just a few weeks after being activated.
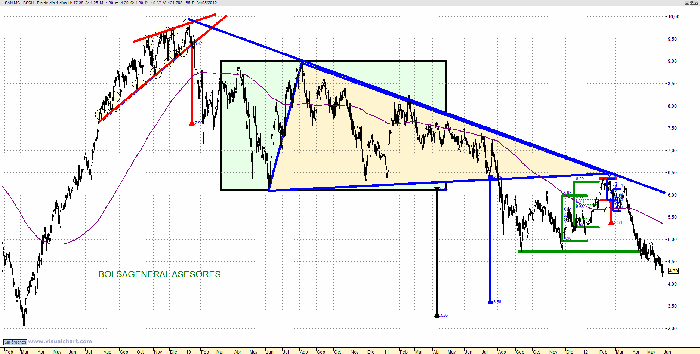
And to finish this review of the triangular figures, we can see the graph of the Ibex, similar to that of Santander, with an ascending wedge during the end of 2009 and activated in January 2010, discussed at the time and which caused sharp falls. Finally, a large triangular figure, with a descending triangle, (indicated in green), which was formed during a good part of 2010 and 2011 and whose downward target towards 7,560 points, was perfectly fulfilled a few months after being activated.


This content has been created by XTB S.A. This service is provided by XTB S.A., with its registered office in Warsaw, at Prosta 67, 00-838 Warsaw, Poland, entered in the register of entrepreneurs of the National Court Register (Krajowy Rejestr Sądowy) conducted by District Court for the Capital City of Warsaw, XII Commercial Division of the National Court Register under KRS number 0000217580, REGON number 015803782 and Tax Identification Number (NIP) 527-24-43-955, with the fully paid up share capital in the amount of PLN 5.869.181,75. XTB S.A. conducts brokerage activities on the basis of the license granted by Polish Securities and Exchange Commission on 8th November 2005 No. DDM-M-4021-57-1/2005 and is supervised by Polish Supervision Authority.