
Market prices are moving everyday - but why? What is moving them? Why do investors decide to buy one asset and sell the other? This can be explained by fundamental analysis.
Market prices are moving everyday - but why? What is moving them? Why do investors decide to buy one asset and sell the other? This can be explained by fundamental analysis.
 In this article, you will learn about:
- What fundamental analysis is?
- How markets react to fundamental factors?
- The key economic reports to watch
- Examples of trades based on fundamental analysis
Market prices are moving everyday - but why? What is moving them? Why do investors decide to buy one asset and sell the other? This can be explained by fundamental analysis.
What is fundamental analysis?
Fundamental analysis is based on the assumption that all assets ought to be valued correctly. Therefore, investors are constantly trying to answer a simple question - does the price of this asset make sense? The logic behind it is clear - if something seems undervalued, investors should buy it. On the other hand, if some markets remain overvalued, it would be reasonable to click the button “sell”.
The fundamental conditions are changing all the time. For instance, if the company releases better-than-expected results, its share price is expected to go up. Similarly, when the economy of the given country is booming and the incoming economic data beats expectations, its stock market and currency are expected to rise. On the other hand, worse-than-expected data from certain companies or countries should be seen as negative for asset prices. Obviously, fundamental analysis may be applied to different markets, not only stocks. In fact, fundamentals have a tremendous impact on different types of markets, including indices, commodities and currencies.
Fundamentals and stock indices
Stock indices generally depend on the macroeconomic conditions, but also individual conditions for specific stocks held within certain indices. Therefore, fundamental traders generally review various economic prints that show how the economy of the given country is doing. If the economy is expanding, companies are able to generate higher profits. In such a scenario, the outlook for companies and the economy in general improves and stock markets are expected to rise.
On the other hand, high inflation is seen as negative for stock indices. The explanation is quite simple - if prices rise too quickly, central banks may consider hiking interest rates, and higher rates mean that there are more alternatives to investing in stocks.
Fundamentals and commodities
As far as commodities are concerned, fundamental analysis is based on either increasing or decreasing the levels of supply and demand. That is why traders are constantly assessing key reports reflecting the global demand on certain commodities, as well as reports on supply or inventories. The key relationship dictating the prices of commodities can be depicted by two simple formulas:
Demand > Supply → Price increase
Demand < Supply → Price decrease
The supply of some commodities is strictly dependent on factors like the weather, production strikes, technology, or government policy. As far as oil markets are concerned, the supply is also impacted by the OPEC cartel. Apart from that, traders pay attention to stockpiles data, which hints at the level of demand. For instance, a higher-than-expected increase in inventories indicates a weaker demand and can be seen as negative for the commodity price.
It should also be noted that major commodities are priced in the US dollar. Generally, commodity prices tend to drop when the USD strengthens. As a result, interest rates in the United States are also of great importance for commodity prices, as the dollar is expected to gain amid higher rates.
Fundamentals and the FX market
The FX market is impacted by various economic reports. Generally, there are two easy-to-understand scenarios that present how local currencies react to economic data:
- employment growth → strong retail sales → rising inflation → hiking interest rates → positive for the currency
- employment decline → weak retail sales → falling inflation → lowering interest rates → negative for the currency
The first case might be associated with the booming economy - it eventually leads to higher interest rates, which is bullish for the currency.
The second case might be associated with slower economic growth or even a recession - this should lead to lower interest rates, which is negative for the currency.
Remember that on the FX market, you always compare one currency with another. Economic data for Japan might be good, but if data for the United States is even better, the US dollar can gain versus the Japanese yen (USDJPY increase). Therefore, you need to look for the strongest and the weakest currencies.
Key economic reports to watch
- NFP (non-farm payrolls) - the number of people employed in the United States during the previous month - a higher than expected figure is taken as positive for the currency (USD in this case). Obviously, each country has its own employment report.
- The Fed’s decision - raising interest rates is taken as positive for the currency (USD here), while lowering interest rates is seen as negative for the currency.
- Inflation reports - higher than expected inflation is usually taken as positive for the local currency, because it means that the central banks could consider raising interest rates.
- GDP data - as the economy rises, companies generate higher profits and people earn more, which could potentially lead to rising stock market indices and a stronger currency.
- Retail sales - strong retail sales suggest that the economy is expanding, which could lead to better-than-expected GDP data and, in turn, stronger currency and advancing stock prices.
- Industrial production - provides information about the change in the volume of output in the industrial sector, which is a part of the GDP report. Strong industrial production is seen as positive for the currency and the local stock market.
- Manufacturing PMI - survey data from companies. Generally, a reading above 50 is seen as positive for the currency and the stock market, but one might also pay attention to the rate of change (rising PMI taken as positive).
- Services PMI - survey data from companies. Similarly to manufacturing PMI, the reading above 50 is seen as positive for the currency and the stock market while the figure below 50 is seen as negative. The rate of change is crucial as well.
Examples of trades based of fundamental analysis
Example 1 - US100
- Case: a trader suspects better-than-expected GDP data from the United States.
- Reaction: US indices are expected to rise after the release.
- Explanation: a sign of investors’ optimism about the economy’s outlook.
A trader decides to open a long position on US100 - a CFD for an index reflecting 100 largest American technology stocks quoted on the organised market. In order to open a long position, a trader should choose an appropriate volume and click the green button that may be found in the upper-left corner of the chart - an instant execution is the quickest way to place any trade. Green button always shows a price at which you can enter a short position.

Please be aware that the presented data refers to the past performance data and as such is not a reliable indicator of future performance.
In order to go long on US100, you can click the green button, which represents buying the contract (the area marked with an arrow is a built-in “Click & Trade” module).
Source: xStation5
Example 2 - DE30
- Case: a trader suspects that the employment data from Germany will fall short of expectations. Reaction: stocks quoted on the German stock exchange are expected to fall.
- Explanation: concerns about the labour market, which usually reflects the “shape” of the economy.
A trader decides to open a short position on DE30 - a CFD for an index reflecting 30 largest German stocks quoted on the organised market. If his/her assumption is right and stocks fall after the labour market data release, the position will become profitable. If however they are wrong, the position may result in a loss.

Please be aware that the presented data refers to the past performance data and as such is not a reliable indicator of future performance.
Traders are able to open short positions directly through the “Market Watch” tab in the xStation 5 platform. In order to do that, all you need to do is click the “sell” button. Alternatively, you can assume that some indices will rise - then you just click the “buy” button. These positions work exactly in the same way, meaning that you are able to bet on both appreciation and depreciation of various financial instruments.
Source: xStation5
Example 3 - Oil
- Case: a trader suspects that US oil inventories will rise more-than-expected, implying weaker demand.
- Reaction: commodity markets should view such phenomena as negative for oil prices.
- Explanation: the reading would imply weaker demand on oil.
A trader decides to open a short position on OIL.WTI, betting that WTI prices will weaken.

Please be aware that the presented data refers to the past performance data and as such is not a reliable indicator of future performance.
In order to go short on OIL.WTI, you can click the “sell” button, thus placing an order. Obviously you do not need to own any underlying instrument while trading CFDs - you just bet that oil prices will fall.
Source: xStation5
Example 4 - Gold
- Case: The Federal Reserve raised its interest rates amid higher-than-expected inflation.
- Reaction: The US dollar strengthens and gold prices fall.
- Explanation: Higher interest rates in the United States and stronger USD are generally seen as negative for the price of gold (and other major commodities as well).
 Please be aware that the presented data refers to the past performance data and as such is not a reliable indicator of future performance.
Example 5 - EURUSD
- Case: Inflation in the United States rises from 3% to 4% while markets expected 3.5% - inflation rises at a faster pace than anticipated.
- Reaction: The US dollar strengthens and EURUSD slides from 1.1880 to 1.1830.
- Explanation: Higher inflation means that the Fed could consider higher interest rates - this is usually positive for the currency (USD in this case).
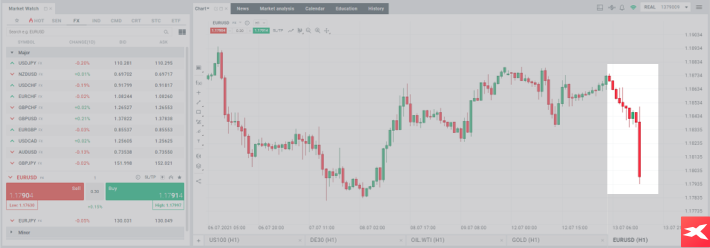
Please be aware that the presented data refers to the past performance data and as such is not a reliable indicator of future performance.
Summary
To sum up, markets react to many economic readings that have tremendous impact on fundamentals - and fundamentals have a dominant role in shaping asset prices. Therefore, traders pay a lot of attention to the economic calendar and try to make use of them while trading.
Fundamentals are important in market analysis, however, it should be noted that in the decision-making process many factors should be taken into consideration and they do not guarantee a specific market movement.
CFDs are complex instruments and come with a high risk of losing money rapidly due to leverage. 77% of retail investor accounts lose money when trading CFDs with this provider. You should consider whether you understand how CFDs work and whether you can afford to take the high risk of losing your money.
This material is a marketing communication within the meaning of Art. 24 (3) of Directive 2014/65/EU of the European Parliament and of the Council of 15 May 2014 on markets in financial instruments and amending Directive 2002/92/EC and Directive 2011/61/EU (MiFID II). Marketing communication is not an investment recommendation or information recommending or suggesting an investment strategy within the meaning of Regulation (EU) No 596/2014 of the European Parliament and of the Council of 16 April 2014 on market abuse (market abuse regulation) and repealing Directive 2003/6/EC of the European Parliament and of the Council and Commission Directives 2003/124/EC, 2003/125/EC and 2004/72/EC and Commission Delegated Regulation (EU) 2016/958 of 9 March 2016 supplementing Regulation (EU) No 596/2014 of the European Parliament and of the Council with regard to regulatory technical standards for the technical arrangements for objective presentation of investment recommendations or other information recommending or suggesting an investment strategy and for disclosure of particular interests or indications of conflicts of interest or any other advice, including in the area of investment advisory.
The marketing communication is prepared with the highest diligence, objectivity, presents the facts known to the author on the date of preparation and is devoid of any evaluation elements. The marketing communication is prepared without considering the client’s needs, his individual financial situation and does not present any investment strategy in any way. The marketing communication does not constitute an offer of sale, offering, subscription, invitation to purchase, advertisement or promotion of any financial instruments.
X-Trade Brokers Dom Maklerski S.A. is not liable for any client’s actions or omissions, in particular for the acquisition or disposal of financial instruments, undertaken on the basis of the information contained in this marketing communication.
In the event that the marketing communication contains any information about any results regarding the financial instruments indicated therein, these do not constitute any guarantee or forecast regarding the future results.

Portfolio Diversification – How to diversify your trading portfolio?
Short Selling – What Is Short Trading?

Market Sentiment and Positioning
This content has been created by XTB S.A. This service is provided by XTB S.A., with its registered office in Warsaw, at Prosta 67, 00-838 Warsaw, Poland, entered in the register of entrepreneurs of the National Court Register (Krajowy Rejestr Sądowy) conducted by District Court for the Capital City of Warsaw, XII Commercial Division of the National Court Register under KRS number 0000217580, REGON number 015803782 and Tax Identification Number (NIP) 527-24-43-955, with the fully paid up share capital in the amount of PLN 5.869.181,75. XTB S.A. conducts brokerage activities on the basis of the license granted by Polish Securities and Exchange Commission on 8th November 2005 No. DDM-M-4021-57-1/2005 and is supervised by Polish Supervision Authority.