
Chart patterns are a popular method used in technical analysis to analyse and predict price movements in the financial markets. Traders and investors use chart patterns to identify potential entry and exit points in the market, which can help them make more informed trading decisions. These patterns are formed by the price movements of a financial instrument, such as a stock, currency pair, commodity, or index, over a specific period of time. Here, we'll explore some common chart patterns and their characteristics.
Chart patterns are a popular method used in technical analysis to analyse and predict price movements in the financial markets. Traders and investors use chart patterns to identify potential entry and exit points in the market, which can help them make more informed trading decisions. These patterns are formed by the price movements of a financial instrument, such as a stock, currency pair, commodity, or index, over a specific period of time. Here, we'll explore some common chart patterns and their characteristics.
What are the most common chart patterns?
1. Head and Shoulders Pattern:
- This pattern consists of three peaks with the middle peak (head) being higher than the other two (shoulders).
- The left shoulder forms as the price rises to a peak, followed by a decline.
- The head forms as the price rises again but reaches a higher peak than the left shoulder, followed by another decline.
- The right shoulder forms as the price rises once more but fails to exceed the head's height, followed by a decline.
- It is considered a reversal pattern, indicating a potential trend change from bullish to bearish.
2. Inverse Head and Shoulders Pattern:
- This is the opposite of the head and shoulders pattern and indicates a potential trend change from bearish to bullish.
- It consists of three valleys with the middle valley (head) being lower than the other two (shoulders).
- The pattern's characteristics mirror those of the regular head and shoulders pattern but in an inverted manner.

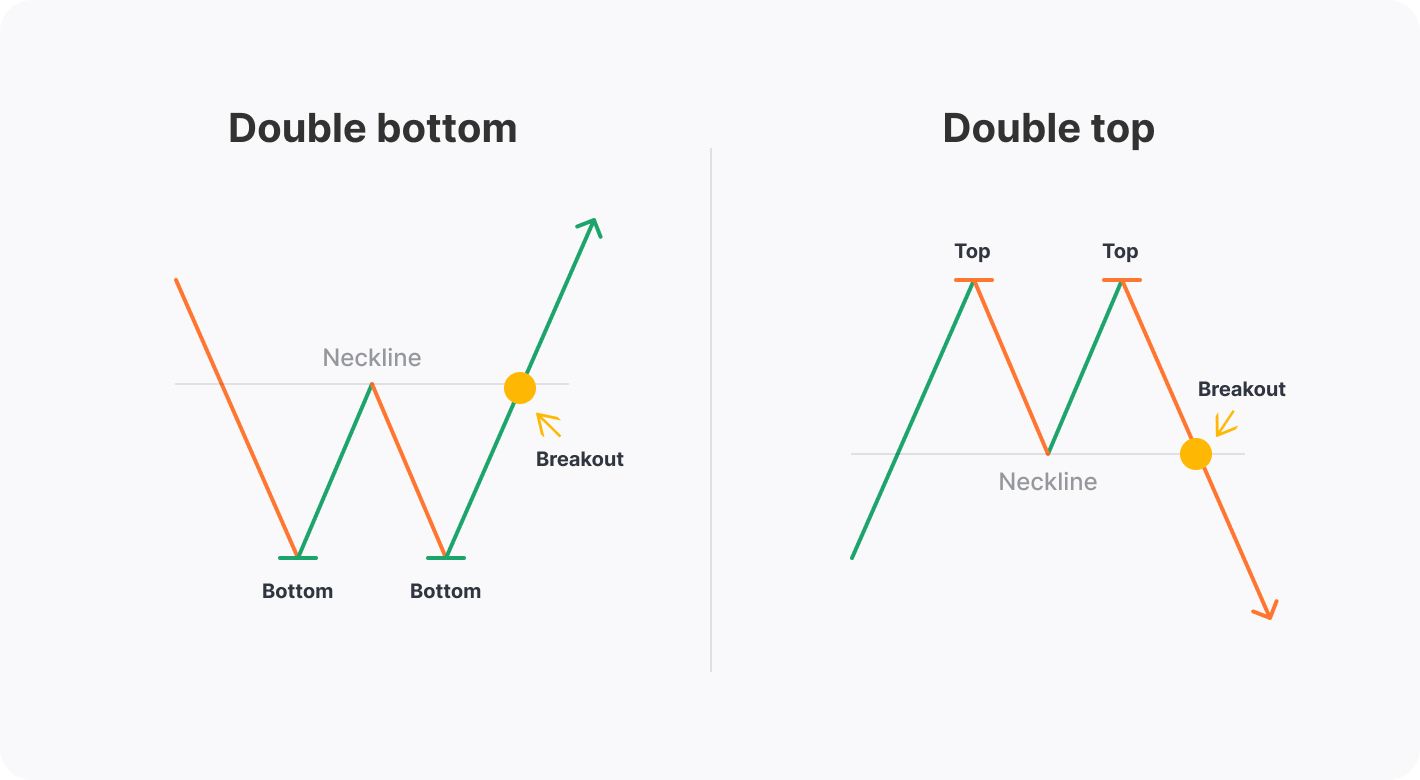
3. Double Top and Double Bottom:
- A double top is formed when the price reaches a peak (resistance), then declines, and later rises again to form a second peak at a similar level as the first one.
- A double bottom is the opposite, formed by two price troughs (support) at approximately the same level.
- These patterns indicate potential trend reversals.
4. Triple Top and Triple Bottom:
- Similar to double tops and double bottoms, but these patterns have three peaks or troughs instead of two.
- The third peak or trough further confirms the potential trend reversal.

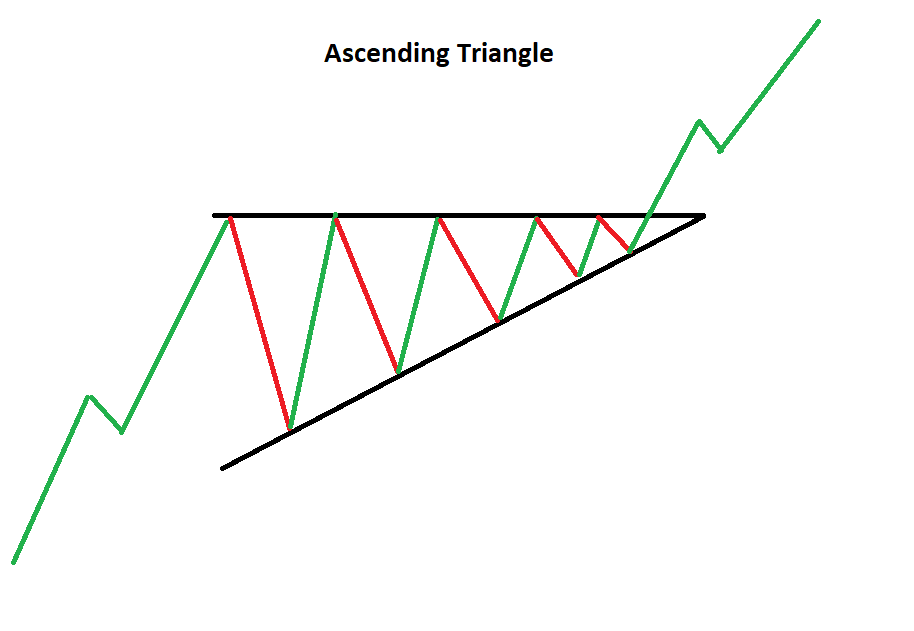
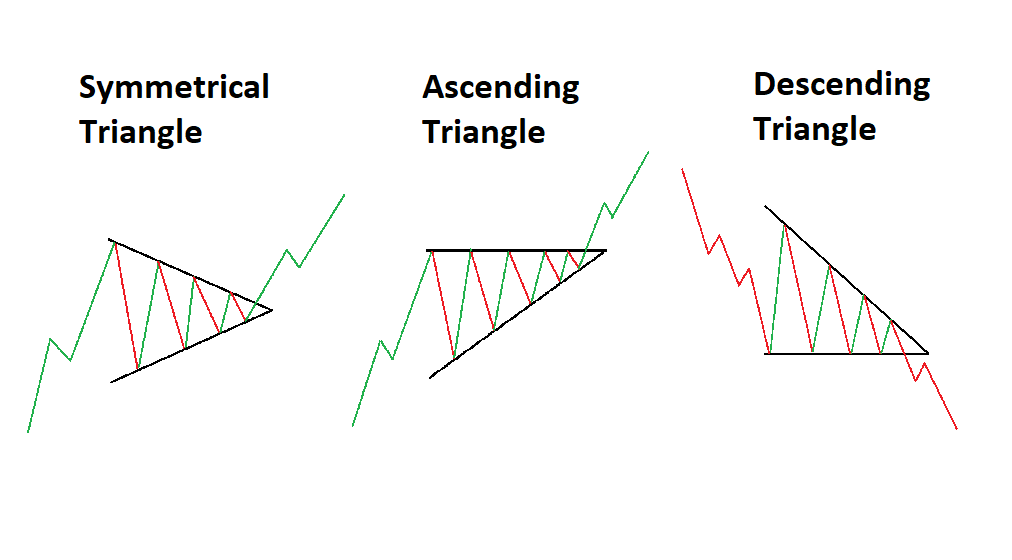
5. Ascending Triangle:
- Formed by a horizontal resistance level and an upward-sloping support line.
- Each time the price touches the resistance, it retreats, and each time it touches the support, it bounces back.
- This pattern suggests that the price may break out upwards, indicating a potential bullish trend continuation.
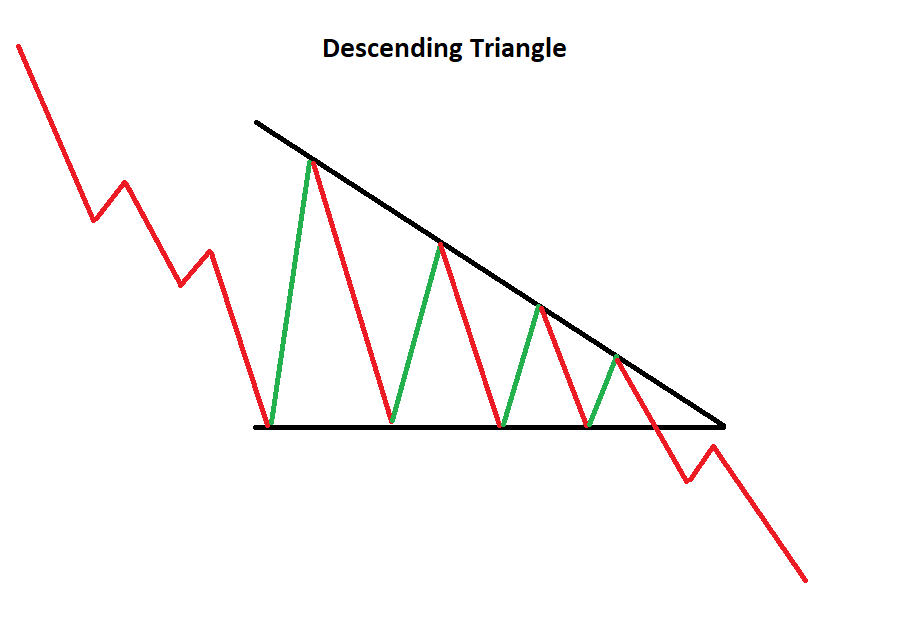
6. Descending Triangle:
- Inverse of the ascending triangle, this pattern has a horizontal support level and a downward-sloping resistance line.
- The price approaches the support and gets pushed back, while it approaches the resistance and gets rejected.
- This pattern suggests that the price may break out downwards, indicating a potential bearish trend continuation.
7. Symmetrical Triangle:
- Formed by converging trendlines, with both the support and resistance getting closer together over time.
- The price oscillates between these lines, forming higher lows and lower highs.
- This pattern doesn't indicate a specific directional bias and can break out either upwards or downwards.
8. Cup and Handle:
- A bullish continuation pattern that resembles a cup with a handle.
- The cup is formed as the price gradually declines and then rises back to approximately the same level.
- The handle is a small dip in price that follows the cup's rise.
- A breakout above the handle's resistance level indicates a potential uptrend continuation.

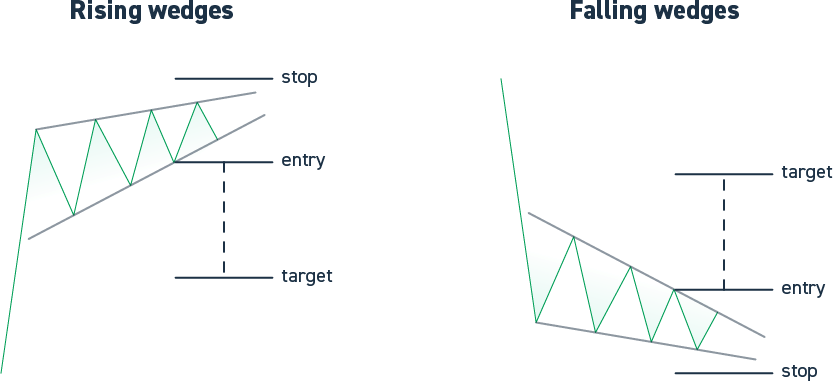
9. Wedge Patterns:
- Rising Wedge: Formed by converging trend lines with a higher resistance line and a higher support line. It usually indicates a bearish trend.
- Falling Wedge: Formed by converging trend lines with a lower resistance line and a lower support line. It usually indicates a bullish trend.
10. Pennant:
- A short-term continuation pattern that resembles a small symmetrical triangle.
- It is formed after a significant price movement, representing a period of consolidation before the price continues in the previous direction.

11. Flag:
- Another continuation pattern, formed by two parallel trendlines, representing a brief pause in a strong price trend.
- It is characterised by its rectangular shape, resembling a flagpole (the initial strong price move) and the flag itself (a period of consolidation).

What is the significance of volume in chart patterns?
Volume can provide additional confirmation to a chart pattern. For instance, higher volume during the formation of a pattern can indicate stronger conviction among market participants, increasing the likelihood of its validity.
In chart patterns, volume can be used to:
- Confirm price movements. When volume increases as the price of a security moves up or down, it indicates that there is more buying or selling activity, which can give the movement more significance. For example, if a stock breaks out of a trading range on high volume, it is more likely to be a sustainable move than if it breaks out on low volume.
- Identify trends. Rising volume on uptrends and falling volume on downtrends can help to confirm that a trend is in place. For example, if a stock is in an uptrend and the volume starts to increase, it could be a sign that the trend is accelerating.
- Identify reversals. A decrease in volume after a sharp price move can be a sign that a reversal is underway. For example, if a stock has been rising on high volume and then the volume starts to decrease, it could be a sign that the uptrend is coming to an end.
Overall, volume is a valuable tool for technical analysis that can help to confirm price movements, identify trends, and spot reversals. However, it is important to remember that volume is not a perfect indicator and should be used in conjunction with other technical indicators to make trading decisions.
Investors should look for divergences between price and volume. A divergence occurs when price and volume move in opposite directions. This can be a sign that a trend is about to reverse. Considering the volume of the overall market in a particular stock can be affected by the volume of the overall market. For example, if the overall market is experiencing low volume, then it is more likely that a stock will also experience low volume.Use volume filters. Volume filters can be used to identify stocks that are trading on high or low volume. This can be helpful for finding stocks that are likely to be trending or that are about to reverse.
When should I enter or exit a trade based on a chart pattern?
The entry and exit points for a trade based on a chart pattern can vary depending on the specific pattern and the trader's strategy. Generally, traders enter a trade when the pattern is confirmed by a breakout or breakdown of a significant price level. They may exit the trade when the pattern's target is reached or when there are clear signs of a trend reversal.
Final Thoughts
Investors should note that chart patterns are not 100% accurate and can sometimes lead to false signals. Always combine chart patterns with other technical indicators and fundamental analysis to increase the probability of successful trades. Additionally, practising with a demo account can be beneficial before risking real money in the market. If you aren’t ready to trade yet why don’t you start your trading journey by creating a demo account? XTB offers a demo account for 30 days where you can trade with fake money and explore your trading skills and platform.
FAQ
Chart patterns are visual patterns formed by the price movements of an asset over time. These patterns can provide insights into potential market trends and reversals.
Chart patterns help traders identify potential entry and exit points in the market. They can offer signals for trend continuation or reversal, which traders can use to make informed decisions.
There are various types of chart patterns, including:
- Trend continuation patterns: These patterns suggest that the existing trend is likely to continue. Examples include flags, pennants, and rectangles.
- Trend reversal patterns: These patterns indicate that the current trend may be coming to an end, and a reversal is imminent. Examples include head and shoulders, double tops, and double bottoms.
- Consolidation patterns: These patterns indicate a period of indecision in the market, where the price is range-bound. Examples include triangles and wedges.
The reliability of chart patterns depends on various factors, including the market conditions and the time frame being analysed. While some patterns can be highly reliable, others may lead to false signals. It is essential to use chart patterns in conjunction with other technical indicators and risk management strategies.
Yes, chart patterns can be applied to various financial instruments, including stocks, forex, commodities, and cryptocurrencies. The principles behind chart patterns remain consistent across different markets.
Spotting chart patterns involves visually identifying specific formations on a price chart. Traders usually use specialised charting software or trading platforms that have built-in tools to detect and highlight these patterns automatically.
Yes, there are limitations. Chart patterns are subjective and open to interpretation, and different traders may identify different patterns. Moreover, market conditions can change rapidly, leading to false signals. It is crucial to combine chart patterns with other technical and fundamental analysis tools to make well-informed trading decisions.
There are numerous educational resources available online, including books, articles, video tutorials, and online courses, that delve into chart patterns and their applications in trading. It's essential to study from reputable sources and practice using chart patterns on historical data or demo accounts before applying them in real trading scenarios. As mentioned above XTB offers a demon account.

7 Steps to Your First Trade

Hawkish Vs Dovish: Differences Between Monetary Policies Explained
Volatility vs. Risk: Why They're Not the Same And Why That Matters
This content has been created by XTB S.A. This service is provided by XTB S.A., with its registered office in Warsaw, at Prosta 67, 00-838 Warsaw, Poland, entered in the register of entrepreneurs of the National Court Register (Krajowy Rejestr Sądowy) conducted by District Court for the Capital City of Warsaw, XII Commercial Division of the National Court Register under KRS number 0000217580, REGON number 015803782 and Tax Identification Number (NIP) 527-24-43-955, with the fully paid up share capital in the amount of PLN 5.869.181,75. XTB S.A. conducts brokerage activities on the basis of the license granted by Polish Securities and Exchange Commission on 8th November 2005 No. DDM-M-4021-57-1/2005 and is supervised by Polish Supervision Authority.