
What Is the DAX Index?
The DAX (Deutscher Aktienindex) is a blue-chip stock market index consisting of the 30 major German companies trading on the Frankfurt Stock Exchange. According to Deutsche Börse, the DAX measures the performance of the Prime Standard’s 30 largest German companies in terms of order book volume and market capitalisation. It is the German equivalent of the US Dow Jones Industrial Average, and because of its small selection, it does not necessarily represent the vitality of the economy as a whole. The DAX has two versions: the performance index and price index, depending on whether dividends are counted. The performance index, which measures total return, is the more commonly quoted, however, the price index is more similar to commonly quoted indices in other countries. Let’s look at the companies that are included in the DAX index with their market capitalisation (in millions of euro, data from 28th of February, 2018):

How to Analyse the DE30
The two most common ways of analysing the DAX are technical and fundamental analysis.
Fundamental analysts consider all available data to help them determine the relative value of a market, unlike technical analysts who mainly tend to consider price action and trends. Fundamental analysis uses an array of the available data, including corporate earnings reports, geopolitical events, central bank policy, environmental factors and more to help them with their analysis. Analysts search for clues as to the market’s direction in the future. Corporate earnings are especially important for stock market investors, as lower earnings usually lead to a fall of particular stocks, which could result in a fall of the index.
Some examples of macroeconomic and corporate data releases include inflation, corporate earnings and economic conditions.
On the other hand, technical analysis is the practice of forecasting potential future price movements based on the examination of past price movements. Technical analysts believe that if the DAX was on the rise recently, it may gain further in the future because it is in an upward trend. There are many different techniques to identify trends, but much like weather forecasting, the results of technical analysis do not cover all possible eventualities. Instead, technical analysis can help investors anticipate what is likely to happen with prices over time.
How to Trade DAX CFDs with XTB
On XTB’s award-winning platform, xStation 5, you’ll find the DE30, a CFD that moves and behaves exactly like the DAX index. But what are CFDs?
A contract for difference (CFD) creates, as its name suggests, a contract between two parties on the movement of an asset price.
There are several key features of CFDs that make them a unique product:
- CFDs are a derivatives products, which means you don’t actually own the instrument you’re trading - you’re simply speculating on its price movement
- CFDs are leveraged
- You can profit and incur losses from both rising and falling prices
- We offer contracts for differences on over 1500 global markets, including FX, indices, commodities, shares and ETFs
So CFD trading means that you don’t actually own the underlying asset - you’re simply speculating on whether the price will rise or fall.
Let’s take stock investing as an example. Let’s say you’d like to purchase 10,000 shares of Barclays and its share price is 280p, which means that the total investment would cost you £28,000 - not including the commission or other fees your broker would charge for the transaction. In exchange for this, you receive a stock certificate, legal documentation that certifies ownership of shares. In other words, you have something physical to hold in your hands until you decide to sell them, preferably for a profit.
With CFDs however, you don’t own those Barclays shares. You’re simply speculating from the same movements in share price.
This means you gain a much larger market exposure for a relatively small initial deposit. In other words, your return on your investment is significantly larger than in other forms of trading. However, please bear in mind that while leverage can magnify your profits, your losses are also magnified in the same way.
Let’s go back to the Barclays example. Those 10,000 shares of Barclays are at 280p, costing you £28,000 and not including any additional fees or commissions.
With CFD trading however, you only need a small percentage of the total trade value to open the position and maintain the same level of exposure. Let’s suppose that XTB gives you 5:1 (or 20%) leverage on Barclays shares, which means you would only need to deposit an initial £5,600 to trade the same amount.
If Barclays shares rise 10% to 308p, the value of the position will now be £30,800. So with an initial deposit of just £5,600, this CFD trade can make a profit of £2,800. That’s a 50% return on your investment, compared to just a 10% return if the shares were bought physically.
The important thing to remember about leverage, however, is that while it can magnify your profits, your losses are also magnified in the same way. So if prices move against you, you may be closed out of your position by a margin call or have to top up your funds to keep it open - so it’s important to understand how to manage your risk.
If Barclays shares decline 10% to 252p, the value of the position will now be £25,200. So with an initial deposit of just £5,600, this CFD trade has made a loss of £2,800. That’s a -50% loss on your investment, compared to just a -10% loss if the shares were bought physically.
Rising markets
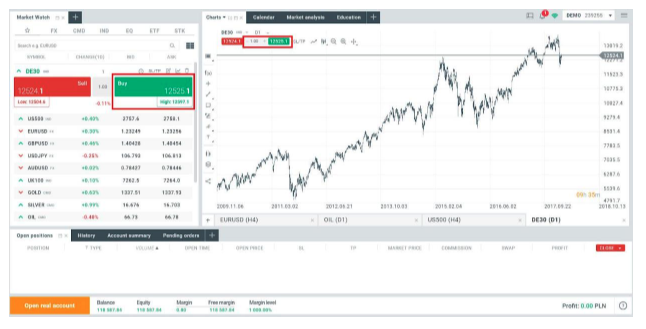
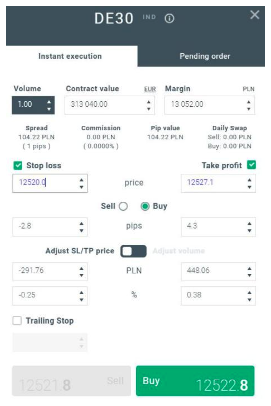
If you believe the price of the DE30 is going to rise, you go long or ‘buy’ and you’ll profit from every increase in price. But how can you place a trade on XTB platform? Let’s take a look at a couple of ways to open a position. First, simply click on the green button above the DE30 chart or find the DE30 in the Market Watch. Then click on the instrument and again on the green button (highlighted in the image below).
You can then choose the details of your position: volume, stop loss and take profit. After opening a trade, the rule is simple: your profit will rise when the DE30 gains, and your loss rises when the market falls. How much you gain or lose depends on your volume size and the size of the market movement.
Falling markets
If you believe the price of the DE30 is going to fall, you go short or ‘sell’ and you’ll profit from every fall in price. Of course, if the markets don’t move in the direction you expect, you’ll suffer a loss. Let’s take a look at an example of a short trade with the chart below. It shows an example of the short trade on the DE30. As you can see, the position was opened at 12417.6. If the market rises towards the stop loss at 12652.2 points, the position will be automatically closed with a loss of 234.6 points. On the other hand, if the market falls towards the take profit level at 12001.3 points, the position will be closed with a profit of 650.9 points. As you can see, it works almost exactly the same as going long or ‘buying’. The only difference is that by going short, you’ll earn when the market falls, and lose when the market gains. Traders go short when they believe the market is overvalued or signalling a reversal in an uptrend.

If you want to open a short position on the platform, simply click on the red button above the DE30 chart or find the DE30 in the Market Watch tab. Next, click on the instrument and again on the red button (highlighted below). Then set the details of your trade: volume, stop loss and take profit. After opening a trade the rule is simple: your profit will rise when the DE30 falls, and your loss rises when the market gains.

So, if you believe for example that the DE30 will fall in value, you simply go short on the DE30 and your profits will rise in line with any fall in price below your opening level. However, should the DE30 price actually rise, you would suffer a loss for every rise in price. How much you profit or lose will depend on your position size (lot size) and the size of the market price movement.


Indices Trading

NASDAQ Trading - How to invest in NASDAQ (US100) index?
How to Start Trading S&P 500?
This content has been created by XTB S.A. This service is provided by XTB S.A., with its registered office in Warsaw, at Prosta 67, 00-838 Warsaw, Poland, entered in the register of entrepreneurs of the National Court Register (Krajowy Rejestr Sądowy) conducted by District Court for the Capital City of Warsaw, XII Commercial Division of the National Court Register under KRS number 0000217580, REGON number 015803782 and Tax Identification Number (NIP) 527-24-43-955, with the fully paid up share capital in the amount of PLN 5.869.181,75. XTB S.A. conducts brokerage activities on the basis of the license granted by Polish Securities and Exchange Commission on 8th November 2005 No. DDM-M-4021-57-1/2005 and is supervised by Polish Supervision Authority.