
In 2022, the attention of the financial markets was turned to galloping inflation, prompting associations with the tumultuous decade of the 1970s in the US, when high interest rates and aggressive central bank policies put pressure on risky assets causing a bear market. Now, when inflation rises again, causing recession risk in the face of global economic slowdown, defensive investing skills are even more important than ever before. Indices are under pressure, technology stocks are slumping and even commodities are not in good shape because of recession risks. Investors are finding the solution and information about what to do during hard times when the US dollar is a king again.
The world's major economies have not seen such a sharp rise in inflation for… nearly 40 years. Soaring interest rates caused unrest almost all over the world, and the radical change in monetary policy caused shock among investors. Some analysts warned of such a turn of events as early as 2021, when the Federal Reserve printed huge amounts of dollars to mitigate the impact of the pandemic. Central banks, however, maintained that inflation would be under control. But it has slipped away and refuses to slow down. In the following article, we will describe this process by listing the reactions of the various asset classes and also point out those that may represent a 'safe haven' in this new trading reality. When you read this article, investing during inflation could be simpler.
What is inflation and why does it happen?
Before we move on to individual asset classes, we will try to briefly and simplistically answer the question of why inflation has risen? Price is, of course, the effect of supply and demand, with prices rising if demand exceeds supply. Significant demand with expiring supply causes a supply shock. These are the basics, of course. In reality, the thing is not so simple and obvious, although the principle works well. But someone who is expecting simple rules in investing during inflation may be wrong.
Nearly 40 years of low inflation caused central banks to 'dangerously' assume that 'things will be different now' and assume that loose monetary policy need not cause high inflation at all. As a result of the coronavirus pandemic, when the global economy went into shock, the US Federal Reserve opted for record money printing to stimulate economic growth and demand. In addition, it launched the Quantitative Easing asset purchase program, which helped the financial markets.
However, it turned out that in fact the condition of consumers was not worsened by the pandemic that much, and trillions of 'fresh' dollars hit the market. The Fed was joined by other central banks, including the ECB (European Central Bank) and the Bank of Japan. In the end, it turned out that the Central Banks did far more than was needed to rescue demand in the global economy. The result was a huge amount of money on the market.
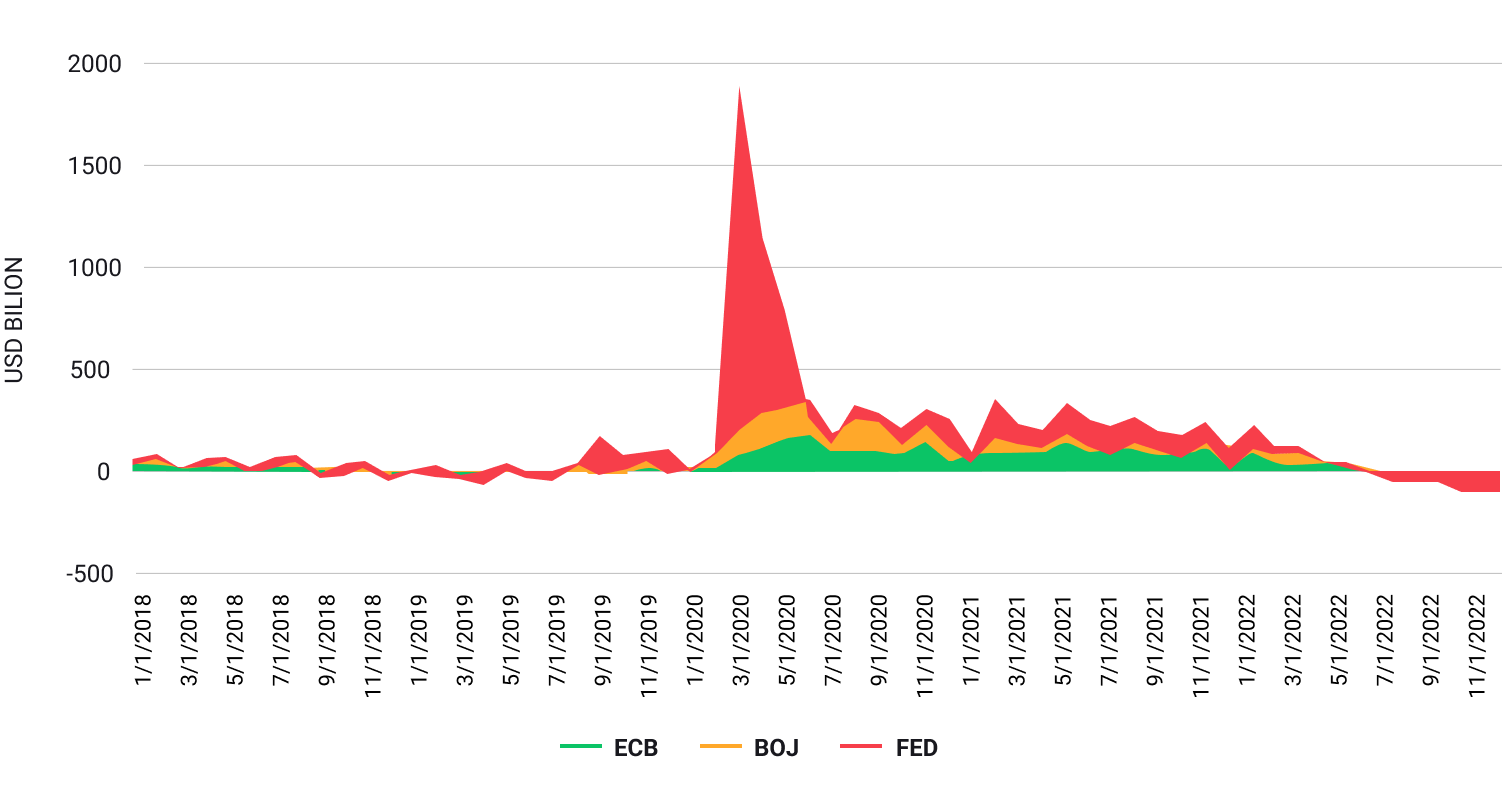 Net QE from ECB, BOJ and FED. Source: Macrobond, XTB Research
At the same time, outages and 'bottlenecks' in supply chains caused by pandemic manufacturing problems and China's zero covid policy continued to strain supply, creating an imbalance between melting supply and still-stimulated, strong demand for services and goods. This was compounded by the 'low base effect' and a situation in which consumers returned to the market after a series of lockdowns, making demand exceptionally strong.
In addition, the sizable amount of cash saved while the economy was shut down compounded the 'hunger to spend.’ When you superimpose a strong labour market and wage pressures on top of that, you have an inflationary bombshell. In fact, economists were already observing some 'pro-inflationary' signals before the pandemic when globalisation slowed down as a result of the crisis in US-China relations and environmental policies that began to raise costs for companies. However, it was the pandemic that proved to be the turning point, determining the global supply and demand imbalance.
 Source: XTB Research
Please be aware that the presented data refers to the past performance data and as such is not a reliable indicator of future performance.
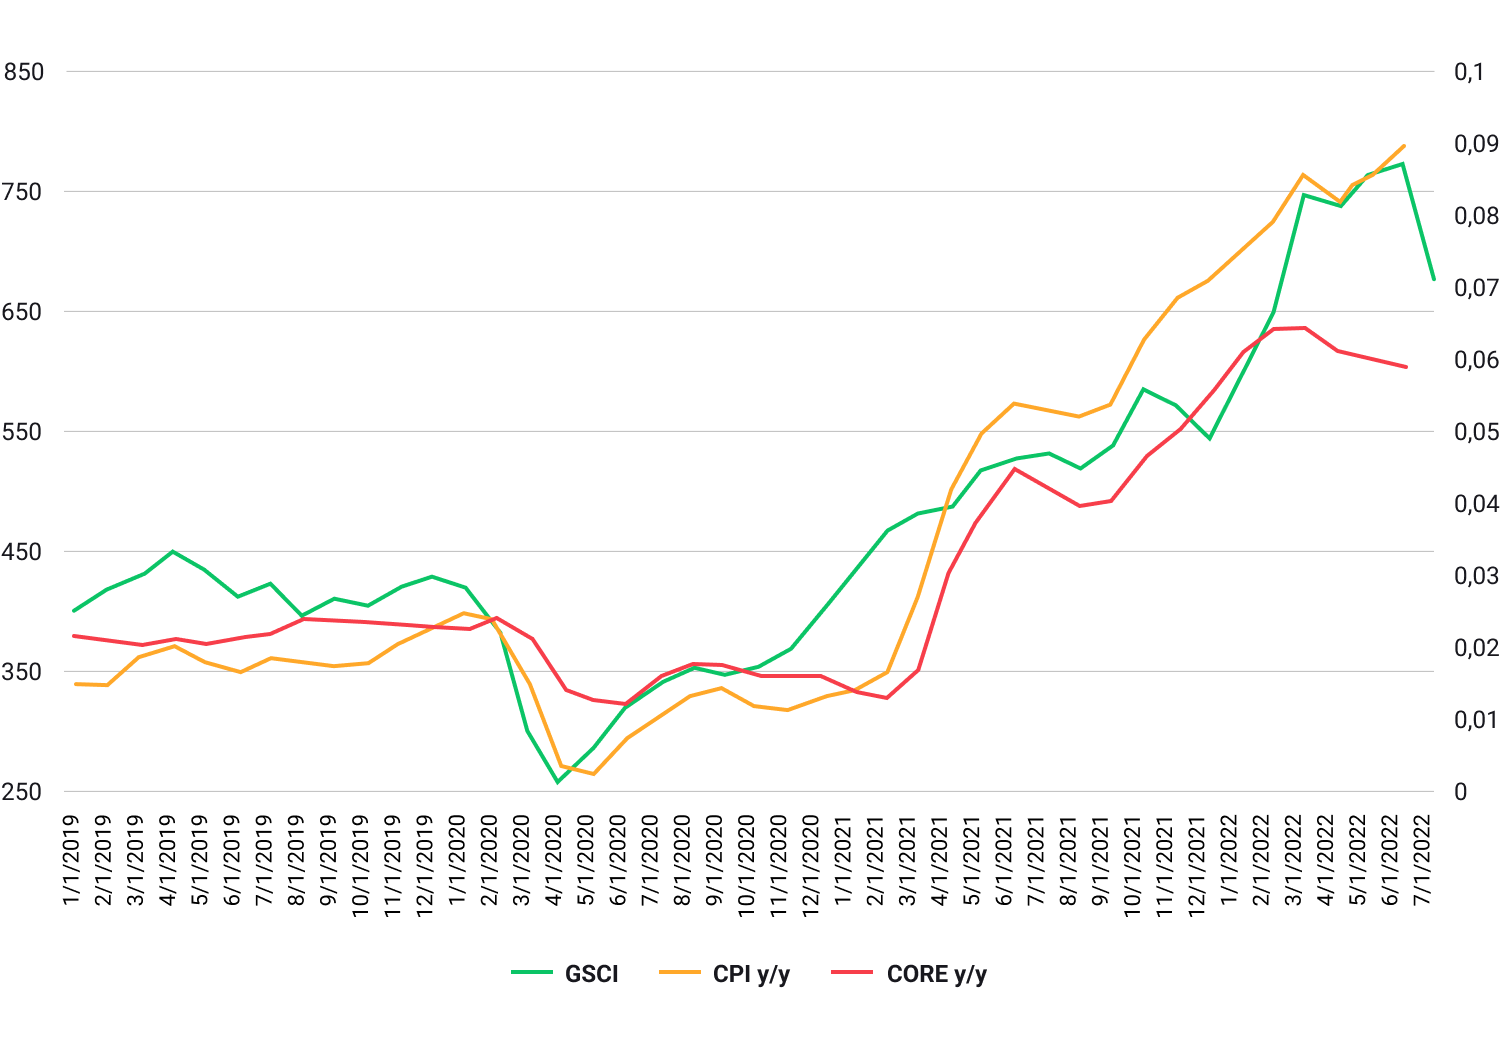
In 1974, a drop in commodity prices helped stabilize inflation but it still remained below acceptable levels. The current time shows many similarities to the 1970s period, when inflation rose on a wave of higher fuel prices (war in the Middle East), wage pressures (labor unions)and imprudent monetary policies of central banks. Source: Macrobond, XTB Research
Please be aware that the presented data refers to the past performance data and as such is not a reliable indicator of future performance.
What then?
High inflation and the sudden turn of central banks' monetary policy toward higher interest rates and Quantitative Tightening (QT, the inverse of QE) programs came as a shock to financial markets and made investing during inflation even harder. The stock market and cryptocurrencies, which had been gaining on the wave of euphoria from 2020 to 2021, came under the most selling pressure. Higher borrowing and financing costs mean problems for debt-financed companies, a halt in the venture capital and private equity investment market. They also mean a cooling of borrowers' consumption, which, combined with high inflation, could have a dampening effect on consumption. In addition, the world has faced a global recession, compounded by the war in Ukraine and the deepening conflict between Washington and Beijing.
The Fed has a tough nut to crack and has to make a decision while being 'between the hammer and the anvil'. A strong labour market and high inflation makes it possible for the Fed to take a risk and stop raising interest rates. This, however, did not end well in the 1970s and led to another painful inflationary peak. Bankers have communicated that they do not want to repeat this mistake. There are two possible solutions:
- Fight inflation and 'whatever it takes' policy
This is what financial markets are afraid of. They are afraid that the Fed will be determined to achieve its inflation target, thus increasing the pain for stock market bulls and putting risky assets under pressure. Under such circumstances, the US dollar is likely to become a natural safe haven. Other assets may come under pressure, including the oil market if a recession engulfs the world.
- Final pivot
The Wall Street is on the lookout for any signs of monetary easing in the Fed's line of communication, and while there have been some, the Federal Reserve is still a long way from cutting or even keeping rate levels unchanged. However, any Fed support for financial markets could be received euphorically in the current economic environment and is likely to push up the valuations of indices, precious metals, cryptocurrencies and weaken the US dollar, which has gained mightily in the first three quarters of 2022.
How to manage risk during high inflation

Markets do not have to give up investing during inflation and idly wait for it to pass. Investors are characterised by a propensity to seek returns under all circumstances, and this is no different during high inflation. Therefore, even in times of rising inflation, there are assets that can behave better than the 'market average'.
Looking at history, a period of high inflation and hawkish banks should cause investors to reduce their risk appetite and buy more defensively. This is reflected in asset prices. Below, we will list assets that may prove resilient to an environment of rising inflation and economic slowdown.
Before we get to them, however, we will list 4 fundamental aspects that every investor who wants to reduce and manage risk should focus on.
Knowledge adoption
The desire to gain knowledge is fundamental from the perspective of any investor. To improve your skills, you need to supplement your workshop and subject yourself to various scenarios. But how to do this without trying to find your own strategy and path in investing through education? It is not possible.
Emotions under control
The market is emotions that overlap with fundamentals and often determine the bear and bull market. For example, the good performance of a given company may not make the market euphoric if the sector in which it prospers does not enjoy positive sentiment. There are investors who have made thousands of percent by buying shares of weak companies at insanely low valuations, and investors who have lost massive money by investing in great businesses when their valuations were far from fundamentals. The investor's task is to skillfully read the emotions of the market and tame the greed and fear that are the routine of every trader.
Second level thinking
The market is a competitive game in which every trader competes with others sitting 'on the other side of the table'. It is not possible for everyone 'in this game' to make money, although this phenomenon usually occurs during the peak phases of euphoria and speculative bubbles when the portfolio of investors buying expensively priced assets, after huge increases, 'glows green'. Investors who want to beat the market average are hoping for higher returns at the expense of greater risk of loss. In contrast, investors who want to be 'average' and invest in index funds risk beating the market average (which is low in weak periods for the stock market), at the expense of limited gains. Few investors actually beat the 'market average', but when they succeed - they can expect above-average returns.
Thinking 'second level' can allow you to beat the market average significantly which is not and just can’t be easy. Let's say a statistical investor wants to buy shares in a company after a successful quarterly report. However, the out-of-the-box thinking investor will decide to sell those shares because he or she sees that the company's share price already includes so much good information that 'it can only get worse'. That's what 'second level thinking' is. Isn't that risky? That's right, but if the analysis turns out to be accurate, this investor will probably secure with it a higher rate of return than the statistical investor who did not try to dig into the valuation and did not want to understand the situation 'deeper'.
Starting an investment in times of inflation and market panic are seen as 'safer' by seasoned investors like Warren Buffett, Howard Marks and one-time Magellan mutual fund manager Peter Lynch. However, the strategy of all these investors was primarily to invest for the long term. But even with those insights investing during inflation is not easy. Traders should use other metrics and indicators.
Risk/Reward Ratio
From a correct understanding of the profit/reward ratio 'risk/reward ratio, it does not always follow that the greater the profit - the greater the reward will be. If this were the case, the highest returns would give the riskiest assets. We know that the market always has a reason to identify assets as 'risky' and this status has a reason, reflected in prices. However, an investor may disagree with the reasons why the market evaluates assets as risky and look for advantages in beating the 'market average'. Undoubtedly, understanding the Risk/Reward ratio can help identify opportunities although there are no 'golden methods' of investment.
Learning from mistakes is the best, especially if investors learn from others' mistakes. However, the market is a place where it is hard to go 'dry-footed', and losses are an inseparable part of investing and trading. Gaining knowledge and developing one's own investment methods based on that knowledge can be effective, and it is up to each investor to tailor the above to his or her own individual risk appetite and asset situation.
In search of ‘safe haven’ assets
Assets referred to by the market as safe haven are assets that may prove to be uncorrelated or negatively correlated with the condition of the global economy or rising inflation. In simple terms, this means that stock market indexes can fall, the economy can be shaken by inflation, and these assets will still allow a rate of return or at least reduce the scale of any losses. However, nothing is certain in the market, and each crisis is different in some way from the previous one. However, there are assets that may prove 'more resilient' to market turmoil and high inflation. These assets are seen as safer than the market average.
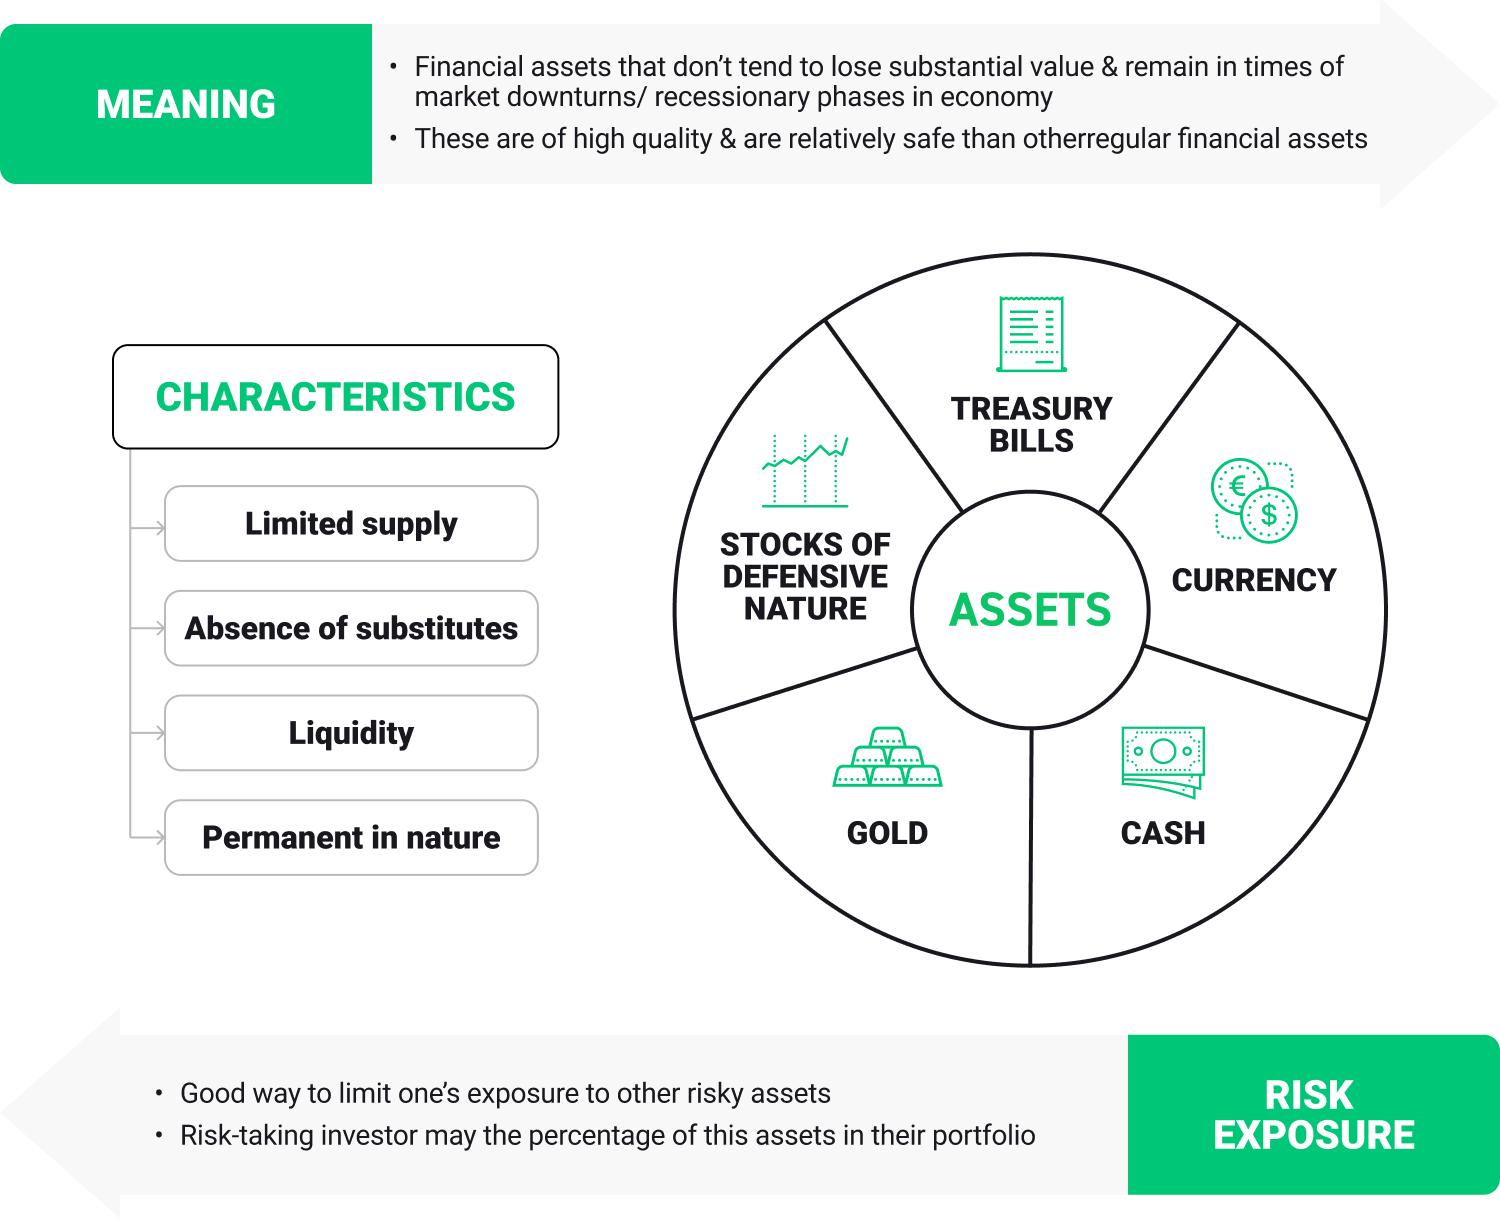
Wide moat conception
It seems clear that the assets of widely recognised brands like Coca Cola, Mc Donald's and Pepsico will prove more resilient to inflationary turmoil than technology startups or advertising revenue-dependent businesses. This is primarily due to the easy 'cost pass-through' to consumers, even in an inflationary environment. It's hard to imagine, with Coca Cola's or Mc Donald's revenues falling at a tremendous rate just because the price of a hamburger or bottle of soda went up 20%, right? Warren Buffett referred to the effect on these types of companies as a 'wide moat' and pointed out the advantage that some companies have over their competitors.
This advantage is measured primarily by the sustained high demand for products, the lack of substitutes and their superior rating against competitors. Such a company can also be Apple; statistics show that people who buy an iPhone are more likely to return for new devices of the same brand than is the case with other, competing manufacturers. Stocks such as Apple also have the added advantage of a statistically 'wealthier customer' whose ability to consume declines more slowly and who is able to accept increases in device prices.
Defensive investors who are expecting risk in the market can also use ETFs that offer exposure to gold prices like the iShares Physical Gold ETC (IGLN.UK) or even index funds like the iShares Core S&P 500 UCITS ETF (CSPX.UK). Investing in index funds statistically offers lower volatility, lower risk and a performance in line with the market average.
Always remember that investing during inflation in assets perceived as a 'safe haven' is not a guarantee of returns, and investors' circumstances and preferred assets change over time.
Aggressive traders in times of market turmoil may undertake risky trading in the VIX Volatility Index (VOLX) known among traders as the 'fear index'. VIX trading can also be some hedge against market risk and an uncertain environment which is negative especially for stocks.
In times of high inflation and problems in the economy, the VIX can rise, reflecting the expected percentage change in the S&P 500 index that investors forecast. Remember, however, that trading leveraged instruments involves a high risk of loss. Here you can read more about the VIX.
Overview asset classes during inflation
Stocks
The debate on the relationship between equity markets and inflation is still open. Equities are backed by actual companies. Since inflation reflects prices of goods and services it should eventually reflect on higher companies revenues. From that perspective equities can be seen as a hedge against inflation. However, looking at historical patterns, there’s certainly no linear correlation between company revenues and stock prices.
Indeed, the so-called price to sales ratio can fluctuate a lot and for many good reasons. Even if higher prices translate into higher revenues, companies' costs may rise even faster. A period of high inflation creates a lot of uncertainties and some companies might be unable to maintain their profit margins. Stock market always tries to discount the future and if it takes place in the face of higher interest rates (typical for higher inflation) the value of future profits will be lower.
Precious metals
Commodities are considered as a leading indicator of inflation as prices of goods and even services are highly dependent on raw material costs. So there is a perception that commodities can be good inflation hedges. But what about gold?
Gold might be a perfect diversifier for a portfolio because of the low or even negative correlation with other asset classes. But what about inflation? Usually we have relatively weak gold in an environment of high inflation in the US in the last 40 years. But gold can also be a diversifier to other risk factors such as natural disasters or even war. The key factors for gold are yield and dollar changes. Strong dollar is usually negative for gold prices.

The chart shows correlation between gold monthly price changes and major global asset classes (January 2000 to August 2022). It shows that gold can be a diversifier to stocks but it is also correlated with bonds. Source: World Gold Council, XTB Research
Please be aware that the presented data refers to the past performance data and as such is not a reliable indicator of future performance.

Gold outperformed S&P 500 5 times in 7 recessions since 1971. On average gold gained 50% in a period of 2 years (one year before and one year after recession started). Source: Bloomberg, XTB Research
Please be aware that the presented data refers to the past performance data and as such is not a reliable indicator of future performance.
Commodities
The whole world is still dependent on energy sources like oil, natural gas or coal, so there is a correlation between energy commodities and inflation. When a price changes moderately, producers do not change prices immediately because they can benefit in the future. However, the problem is when the price multiplies several times and producers' costs have to be passed on consumers.
As we mentioned earlier, the current situation seems to be similar to the 1970s when the energy crisis led to an inflation spiral. As then, the supply of oil is now severely constrained (initially artificially, but now by problems in the supply chain and lack of adequate investment in production capacity). Supply is slowly increasing, but demand is recovering much faster, which has led to a massive increase in prices.

When we are looking at the oil inflation adjusted price we can notice that the 2022 spike wasn’t even close to all-time highs. We should pay attention to the situation from the 70s, when the price adjusted to inflation returned to lower levels only after a long 12 years. The oil fundamentals and macro perspective may be similar to those years, so we could expect high oil prices for longer. Source: Macrobond, XTB Research
Please be aware that the presented data refers to the past performance data and as such is not a reliable indicator of future performance.

Natural gas prices can be dependent on import demand and weather expectations that indicate higher natural gas consumption. Source: Bloomberg, XTB Research
Please be aware that the presented data refers to the past performance data and as such is not a reliable indicator of future performance.
Forex market
Recent returns of higher and unstable inflation around the world cause a spike in exchange rate volatility and depreciation of currencies in countries with the highest inflation. During economic uncertainty, investors usually lean towards safe haven currencies, mostly the US dollar. The dollar index during record inflation can be even at all time highs and is usually stronger than any other currency.

The dollar trade-weighted real exchange rate (TWI REER) in 2022 is close to its 20-year high. During high inflation the US Dollar strengthened. Source: Macrobond, XTB
Please be aware that the presented data refers to the past performance data and as such is not a reliable indicator of future performance.
High energy prices in Europe dampened terms of trade in the euro area that caused even further depreciation of the common currency. When inflation is high and the economy is slowing down, usually the currency is weaker than the US dollar.

Surging energy prices in Europe put a strong, negative pressure on the Euro currency. Source: Bloomberg, XTB Research
Please be aware that the presented data refers to the past performance data and as such is not a reliable indicator of future performance.
Cryptocurrencies
Cryptocurrencies are still a young asset class. Bitcoin's history dates back nearly 10 years, and most of the smaller cryptocurrencies were created after 2017 so the market is still very young. This makes it hard to rely solely on historically poor data when looking at digital asset listings.
Investors sometimes buy crypto to diversify their portfolio, but mostly to achieve the exposure to high-risk assets. The reactions of cryptocurrencies to rising inflation are beginning to resemble those of the stock market, which, based on historical data, are somewhat easier to guide. Rising inflation in general is not good for risky assets like cryptocurrencies.
Even if the trend of crypto adoption continues - and there are signs that it does - price reactions on inflation might resemble those of US100, just on a higher magnitude.
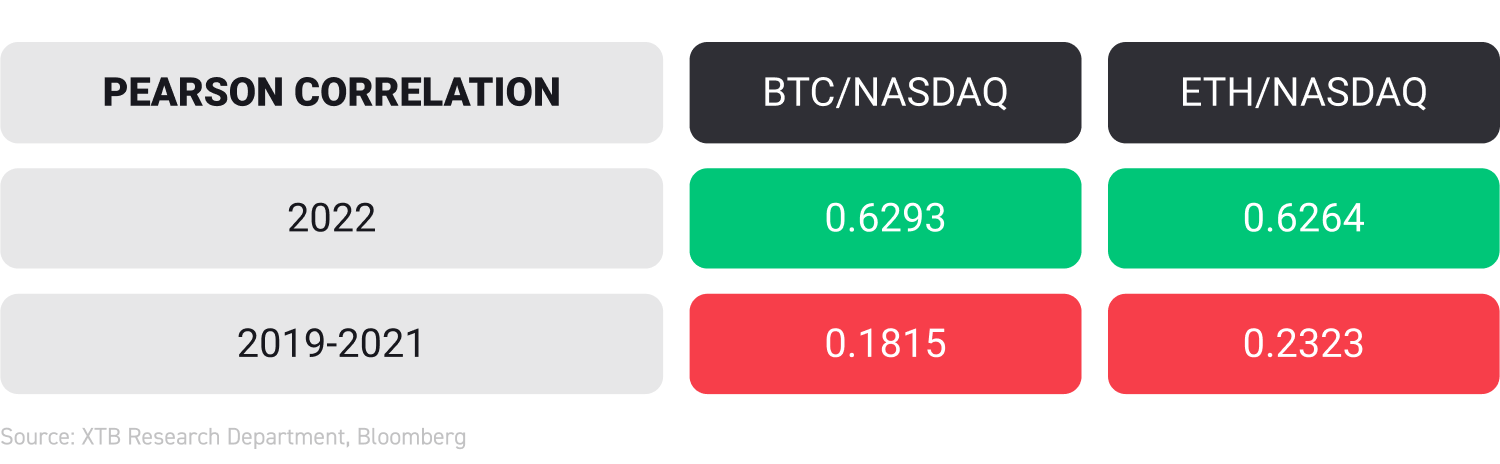
The correlation of the two largest cryptocurrencies in terms of capitalization with the Nasdaq index is particularly visible in 2022. The Pearson correlation in half of 2022 has more than tripled from the 2019 - 2021 period. Now it is still very high. Source: XTB Research Past performance is not necessarily indicative of future results, and any person acting on this information does so entirely at their own risk.
Please note that XTB UK does not offer cryptocurrencies.


This content has been created by XTB S.A. This service is provided by XTB S.A., with its registered office in Warsaw, at Prosta 67, 00-838 Warsaw, Poland, entered in the register of entrepreneurs of the National Court Register (Krajowy Rejestr Sądowy) conducted by District Court for the Capital City of Warsaw, XII Commercial Division of the National Court Register under KRS number 0000217580, REGON number 015803782 and Tax Identification Number (NIP) 527-24-43-955, with the fully paid up share capital in the amount of PLN 5.869.181,75. XTB S.A. conducts brokerage activities on the basis of the license granted by Polish Securities and Exchange Commission on 8th November 2005 No. DDM-M-4021-57-1/2005 and is supervised by Polish Supervision Authority.