
Moving averages are vital for traders who want to improve their performance on the financial markets. A lot of trading platforms integrate these tools into technical charts. Discover the different moving averages in trading, how they are calculated, the best way to determine market trends, strategies based on their crossings and much more. Learn about the moving averages history and usage. Here is the breakdown.
Moving averages are vital for traders who want to improve their performance on the financial markets. A lot of trading platforms integrate these tools into technical charts. Discover the different moving averages in trading, how they are calculated, the best way to determine market trends, strategies based on their crossings and much more. Learn about the moving averages history and usage. Here is the breakdown.
Moving averages: The Definition and Examples
The moving average is a key indicator in technical analysis, used by traders to identify trends and generate trading signals. It represents the average value of a financial asset's price over a given period and helps to smooth out price fluctuations.
When a price is above its moving average, this can indicate an upward trend, and when it is below, it can indicate a downward trend. The crossover technique can generate buy or sell signals to help investors make strategic decisions.
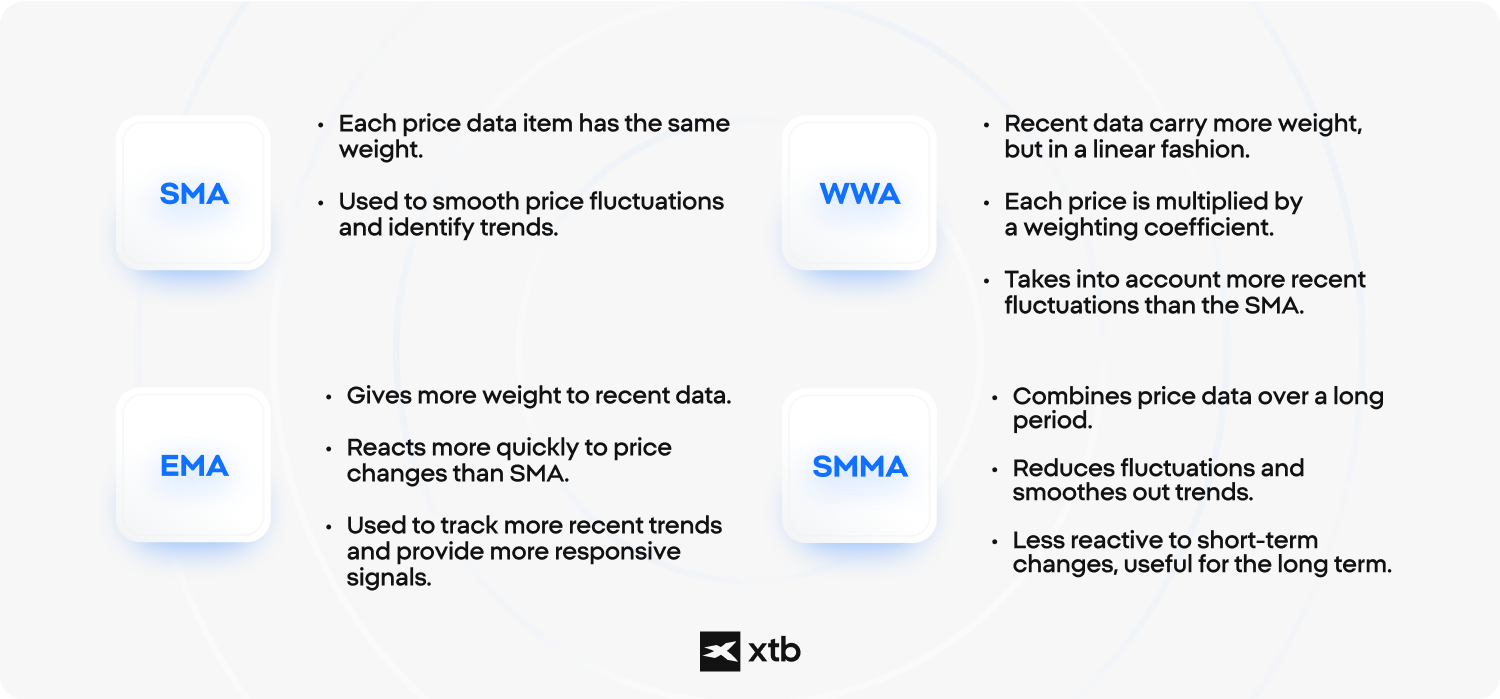
There are four main moving averages, each with specific characteristics that distinguish it from the others.
- Simple moving average (SMA)
- Exponential Moving Average (EMA)
- Linear Weighted Moving Average (WMA)
- Smoothed Moving Average SMMA
By choosing the right type of moving average and taking into account the characteristics of each method, traders can improve their analysis and strategy. To calculate the various moving averages in trading, it is important to understand the basic formulas and their applications.
- Simple Moving Average (SMA) :
To calculate the SMA, add up the closing prices of the trading days over a predefined period of time, then divide this sum by the number of days. For example, for a 10-day SMA, add up the last 10 days and divide by 10.
- Exponential Moving Average (EMA) :
The EMA, on the other hand, gives more weight to recent price data, which makes the curve more responsive to changes in trends.
- Linearly Weighted Moving Average (WMA) :
The WMA uses a different calculation method, assigning a linear weight to recent data.
For a 5-day period, for example, multiply the most recent closing price by 5, the previous one by 4 and so on, then divide the sum of the products by the sum of the weights.
- Smoothed Moving Average SMMA :
The smoothed moving average (SMMA) is a version of the exponential moving average (EMA) that extends over a longer period. It uses a larger number of data points to produce a curve that is more stable and less prone to fluctuations than the simple moving average.
To calculate the SMMA, take the sum of the closing prices over a long period and divide it by the total number of periods. Remember also to include historical data to smooth out fluctuations.
Important: Use suitable IT tools such as trading platforms to automate these calculations and display moving averages on real-time charts. The choice of calculation period is crucial, and should be chosen according to your strategy. Short periods are suitable for short-term trading, while long periods are better suited to investors wishing to make a long-term commitment. Moving averages smooth out price fluctuations but do not predict future movements. Traders use them as a guide, not as a guarantee.
Moving averages and trends

To determine market trends, all you need to do is observe the direction of the trend and the relationship between prices and moving averages.
The market trend is determined by the direction of the moving average. If the moving average is rising, the market is in an uptrend. If it falls, the market is in a downtrend. The same applies to prices below the moving average.
Good to know: moving averages can also be used as support and resistance levels.
For example, in an uptrend, the moving average can act as dynamic support, while in a downtrend, it can act as resistance. Investors monitor these levels to anticipate rebounds or breakouts.
- Use of multiple moving averages :
Using several moving averages for different periods can provide a more complete view of your investments. A common strategy is to use three types: short, intermediate and long. If all three are aligned in the same direction, the trend is strong and well established.
- Integration of other indicators :
To reinforce moving average signals, traders often use other technical indicators such as the MACD (Moving Average Convergence Divergence). The MACD, based on two EMAs, can help identify changes in trend and provide additional indications.
It is always important to consider the overall market context before making decisions based solely on moving averages. These are indicators that reflect past trends. To minimise risk, they should be combined with fundamental analysis and other indicators.
In addition, adjust the periods taken into account according to your trading horizon and market volatility. Rigorous analysis and a well-defined strategy are essential to success as a trader.
Trading strategies based on moving average crossovers
Trading strategies based on moving average crossovers involve exploiting the signals generated when two moving averages from different periods cross. These crossings can indicate buying or selling opportunities.
Golden cross and cross of death
The golden cross strategy occurs when the short moving average (e.g. 50-day SMA) crosses above the long moving average (e.g. 200-day SMA). It signals potential buying. Conversely, the death cross occurs when the short moving average falls below the long moving average.
Good to know: moving average crosses are more reliable over longer periods. For example, a cross on a daily chart carries more weight than a cross on an hourly chart. Long-term investors often prefer moving average crosses over periods of 50 and 200 days to minimise false signals.
Double-crossing strategy
This method uses two moving averages of different periods. A buy signal is generated when the short moving average crosses above the long moving average, while a sell signal is generated when the short moving average crosses below the long moving average. Good to know: to avoid false signals, combine moving average crossovers with other indicators such as the RSI or MACD. This will help to reduce the risks considerably.
Important: Backtests are used to check the effectiveness of the strategy and adjust parameters to optimise results. Don't forget to use stop-losses to manage risk and protect your capital.
Advantages and disadvantages of using moving averages
Moving averages are invaluable tools in technical analysis, and each has its advantages and disadvantages. Find out what they are.
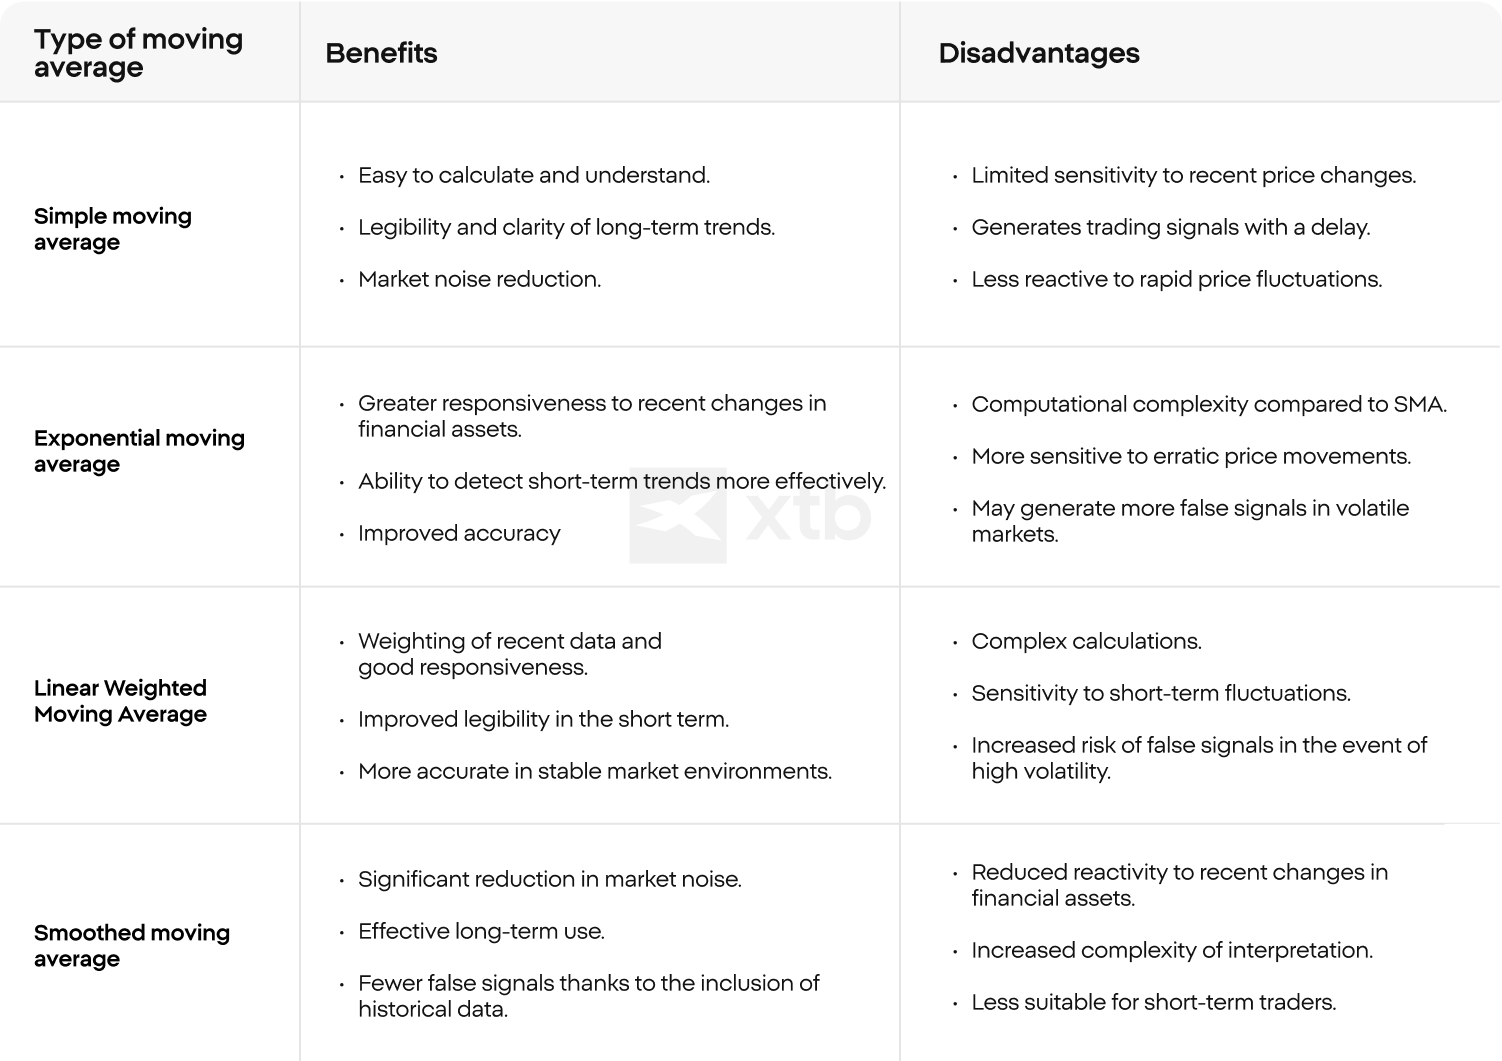
Important: So-called market noise refers to minor, erratic price movements that do not reflect underlying trends. These movements can be caused by emotional reactions, low-volume transactions or events of no significant importance. Moving averages help to reduce this noise by smoothing price data to reveal clearer patterns. To maximise the advantages of moving averages and minimise their disadvantages, it is advisable to test several periods and types of moving averages on historical data. Traders should also adjust their strategies according to current market conditions and their personal objectives.
Moving Averages: 10 important tips
By enabling market trends to be identified quickly, this tool is an essential part of technical analysis. In addition, the different types of moving average each offer specific advantages, ranging from simplicity of calculation to greater responsiveness to price fluctuations. By identifying how to calculate and use these technical tools, investors will be able to refine their methods, reduce market noise and make more informed buying and selling decisions.
- Choose the Right Type of Moving Average for Your Strategy
Use a Simple Moving Average (SMA) for a broader view of trends and an Exponential Moving Average (EMA) for faster reactions to price changes.
- Match the Timeframe to Your Goals
Short-term traders can use 5, 10, or 20-period moving averages, while long-term investors may prefer 50, 100, or 200-period averages to identify broader trends.
- Combine Moving Averages for Crossover Signals
Use a short-term MA (e.g., 20-day) and a long-term MA (e.g., 50-day) to spot crossovers. A bullish crossover occurs when the short-term MA crosses above the long-term MA, signalling a potential uptrend.
- Use Moving Averages as Dynamic Support and Resistance Levels
Prices often bounce off moving averages, acting as support in an uptrend and resistance in a downtrend.
- Pair Moving Averages with Other Indicators
Enhance your analysis by combining moving averages with tools like the Relative Strength Index (RSI) or MACD to confirm trends and entry/exit points.
- Adapt to Market Conditions
In trending markets, moving averages can help confirm the direction. In sideways markets, moving averages may produce false signals, so adjust your approach.
- Don’t Rely Solely on Moving Averages
Moving averages are lagging indicators, reflecting past price action. Combine them with leading indicators or price action analysis for better results.
- Monitor the Slope of the Moving Average
An upward slope indicates bullish momentum, while a downward slope signals bearish momentum. A flat MA suggests a consolidating market.
- Backtest Strategy
Test how moving averages perform on your chosen asset and timeframe before using them in live trading to ensure they align with your trading goals.
- Keep Risk Management in Focus
Use stop-loss orders and proper position sizing alongside moving averages to manage potential losses and protect your capital.
Moving average crossovers, such as golden crossovers and death crossovers, can provide clear indications for entering or exiting positions, while the combination of several stock market indicators can reinforce these signals and minimise risks. To optimise your performance, it is crucial to integrate these tools into an overall risk management approach.
Summary
Moving averages are a fundamental tool in technical analysis, designed to smooth out price data and highlight market trends. By calculating the average price of an asset over a specific period, they help traders reduce noise and make more informed decisions.
Understanding moving averages empowers traders to navigate markets more effectively, making this tool indispensable for both beginners and experienced investors.
FAQ
Moving averages are a technical analysis tool that calculates the average price of an asset over a specific time period, smoothing out price fluctuations to identify trends.
A moving average is calculated by summing the closing prices of an asset over a set number of periods and dividing by that number. For example, a 10-day moving average adds the last 10 closing prices and divides the sum by 10.
The two most common types are:
- Simple Moving Average (SMA): Gives equal weight to all data points.
- Exponential Moving Average (EMA): Places more weight on recent prices for quicker trend detection.
Moving averages help traders to identify market trends (upward, downward, or sideways), spot potential entry and exit points as well as reduce noise in volatile markets for clearer analysis.
The SMA smooths data evenly across the chosen period, while the EMA reacts faster to recent price changes, making it more responsive to short-term movements.
Traders often use moving averages to:
- Identify support and resistance levels.
- Spot crossovers (e.g., when a short-term moving average crosses a long-term one, signalling a potential trend change).
- Confirm trends alongside other technical indicators.

The Bond Rating System: A Key to Understanding Credit Risk
How to Invest in Bonds: Strategies for passive income

Understanding ISAs: A Tax-Efficient Way to Save and Invest
This content has been created by XTB S.A. This service is provided by XTB S.A., with its registered office in Warsaw, at Prosta 67, 00-838 Warsaw, Poland, entered in the register of entrepreneurs of the National Court Register (Krajowy Rejestr Sądowy) conducted by District Court for the Capital City of Warsaw, XII Commercial Division of the National Court Register under KRS number 0000217580, REGON number 015803782 and Tax Identification Number (NIP) 527-24-43-955, with the fully paid up share capital in the amount of PLN 5.869.181,75. XTB S.A. conducts brokerage activities on the basis of the license granted by Polish Securities and Exchange Commission on 8th November 2005 No. DDM-M-4021-57-1/2005 and is supervised by Polish Supervision Authority.