
- A moving average is a trend-following indicator based on past prices.
- A moving average is calculated by choosing certain periods and then dividing this number by the number of chosen periods.
- Moving averages can help in smoothing out of price action.
- Moving averages are used not only to identify the direction of the trend, but also for trade entry.
The two basic and most commonly used moving averages include the Simple Moving Average (SMA) and the Exponential Moving Average (EMA). The first is the simple average of a security over a defined number of time periods, while the second gives a greater weight to more recent prices.
The image below shows the SMA, which is formed by calculating the average price of a financial market over a chosen period of time.

The EMA, as demonstrated in the image below, applies more weight and significance to most recent prices, and less weight to older prices in the chosen period.

The image below shows a comparison between the SMA (blue line) and the EMA (orange line).
Why use moving averages in trading
Moving averages are popular in technical market analysis, as they are able to smooth price data, form trend lines, and create an easily interpreted visual aid. They are especially well-suited for price charts and other indicators. Some of the advantages of using moving averages include:
- Moving average is used for forecasting goods or commodities with constant demand, where there is a slight trend or seasonality.
- Moving average is useful for separating out random variations.
- Moving average can help you identify areas of support and resistance.
- Simplicity of application and interpretation makes it possible to plot several different moving average lines at the same time.
- Moving average gives constant forecasts.
Disadvantages of moving averages
No method is perfect, and moving average comes with its own set of disadvantages. Moving average:
- Requires maintaining history of different time periods for each forecasted period.
- Often overlooks complex relationships mentioned in the data.
- Does not respond to the fluctuation that take place for a reason, for example cycles and seasonal impacts.
How to trade using moving averages
There are various methods of using moving averages in trading. Below we focus primarily on:
- Using one moving average
- Using two moving averages
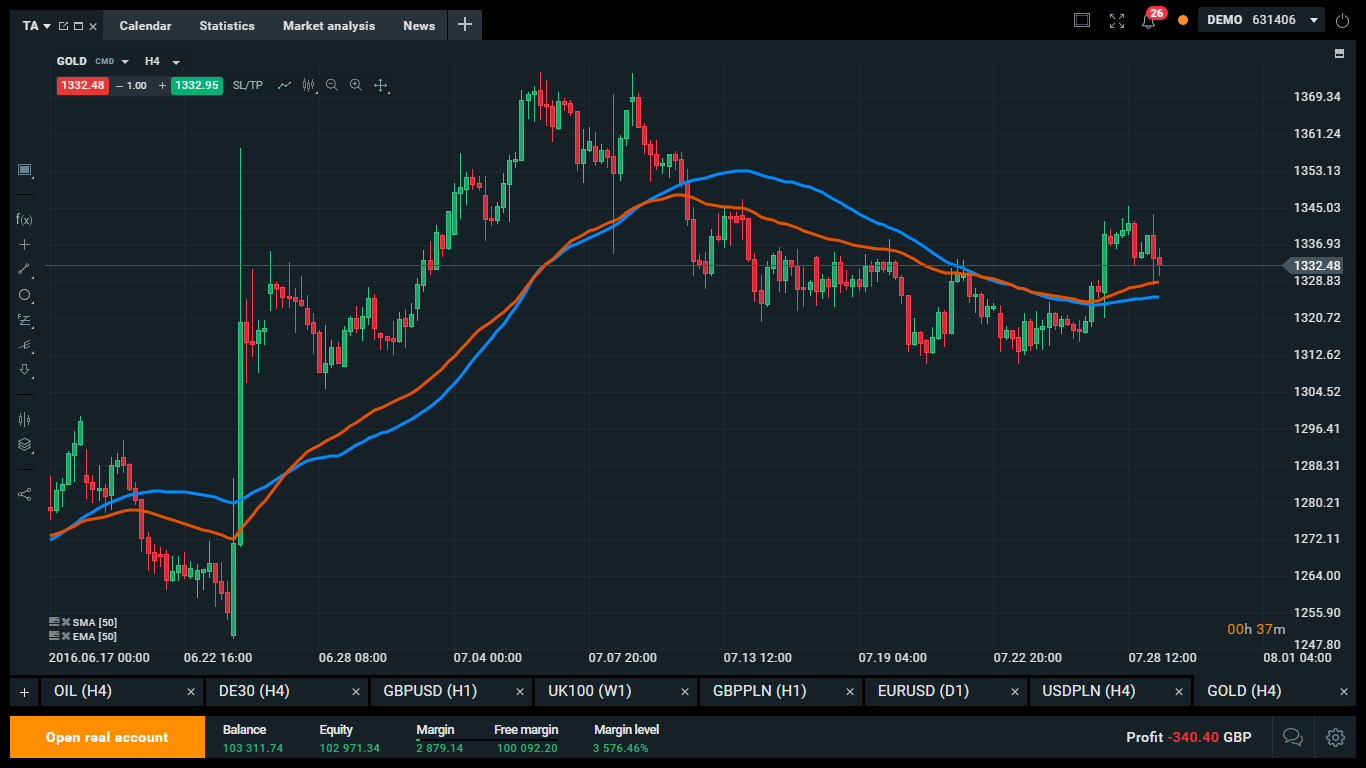
1. Using One Moving Average
When one moving average is applied to the chart, then a buy signal is provided when the chart breaks the moving average from the bottom with the body of a candlestick. On the other hand, a sell signal is provided when the chart breaks the moving average from the top with the body of a candlestick.

In the example above, a 50 period SMA was applied to Gold. As you can see, the market first provided a buy signal, after which the market gained in value. Later the market broke the SMA from the top providing a sell signal, after which the market lost in value.
2. Using Two Moving Averages
When two moving averages are used with two different periods, a buy signal is provided when the shorter term moving average breaks the longer term moving average from the bottom. On the other hand, a sell signal is provided when the shorter moving average breaks the longer term moving average from the top.
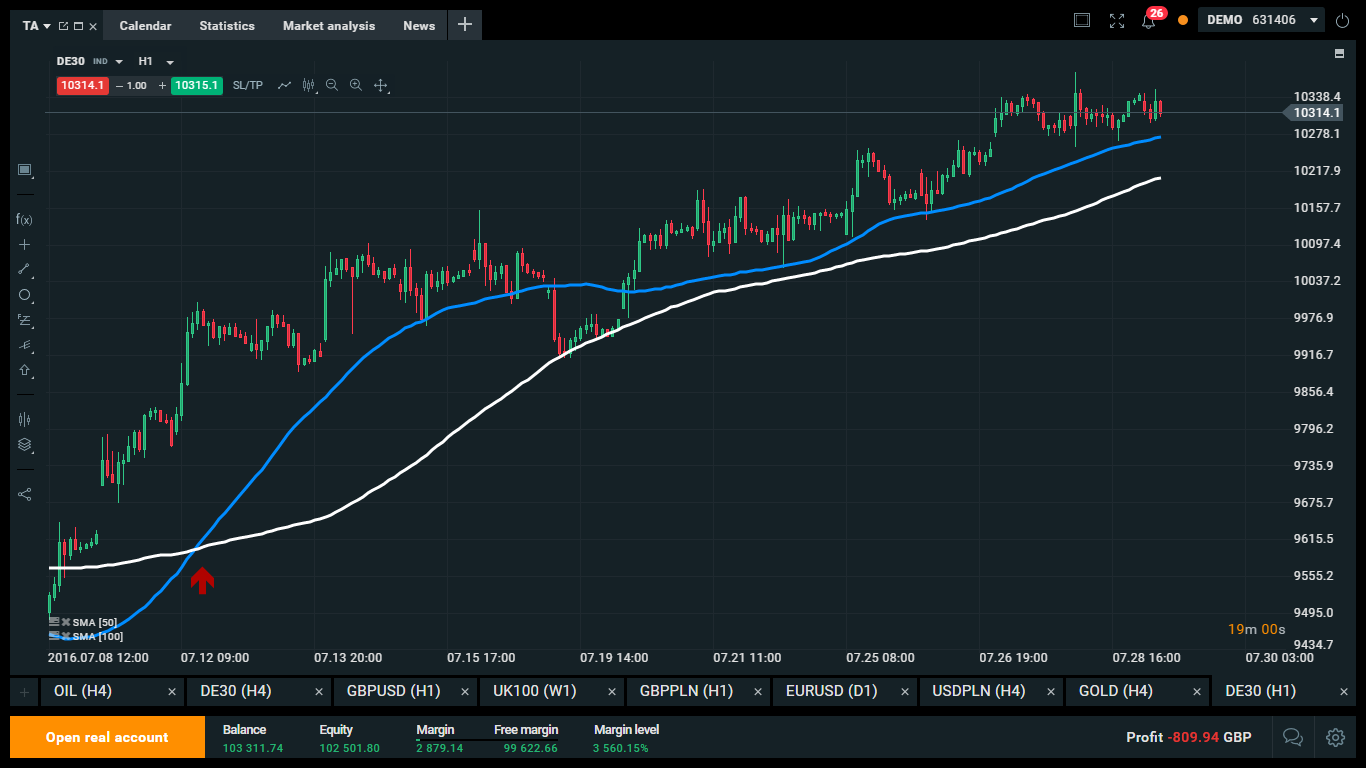
In the example above, a 50-period SMA (blue line) and a 100-period SMA (white line) were applied on the DE30 chart. A buy signal was provided when the 50-period SMA broke the 100-period SMA from the bottom, after which the market gained in value.
Keep in mind, however, that all indicators and oscillators often provide false signals and should thus be used with other technical analysis tools. When all the tools you’ve used indicate the same direction for the market, this increases the probability of the success of the trade.


This content has been created by XTB S.A. This service is provided by XTB S.A., with its registered office in Warsaw, at Prosta 67, 00-838 Warsaw, Poland, entered in the register of entrepreneurs of the National Court Register (Krajowy Rejestr Sądowy) conducted by District Court for the Capital City of Warsaw, XII Commercial Division of the National Court Register under KRS number 0000217580, REGON number 015803782 and Tax Identification Number (NIP) 527-24-43-955, with the fully paid up share capital in the amount of PLN 5.869.181,75. XTB S.A. conducts brokerage activities on the basis of the license granted by Polish Securities and Exchange Commission on 8th November 2005 No. DDM-M-4021-57-1/2005 and is supervised by Polish Supervision Authority.