
- ‘Support’ and ‘resistance’ levels are common phrases used in trading to describe specific price levels where markets historically have had difficulty breaking through.
- Traders seek to identify these support and resistance levels to help them to pinpoint new trading opportunities and forecast where prices could head to next.
- Support levels tend to stop prices from falling any lower, i.e. giving prices support.
- Resistance levels tend to stop prices from increasing further, i.e. act like a price ceiling of resistance.
- Understanding and identifying support and resistance levels is vital in technical analysis and trading in general.
- There are a plethora of tools that can help you to understand where these key levels can be found.
What is support and resistance in trading?
A support level is found beneath the current price of an instrument and tends to be where falling prices find a floor of support. This means the price is more likely to ‘bounce’ off this level rather than break through it.
A resistance level is found above the current price of an instrument, and acts as a ceiling for prices as they rise. The opposite of a support level, a resistance level means that the price is more likely to fall back from this level than break through it.
When support/resistance levels are broken, a breakthrough or bounceback typically takes place - until another support or resistance level is found.
Support and resistance levels are key factors for technical traders, because very often those are the levels at which they will open trades and look for bouncebacks or breakthroughs. While a bounceback is more probable than a breakthrough, the latter would be a signal that the market may reverse trends at least in the short-term.
Additionally, after a support level is broken, it becomes a new level of resistance. When a resistance level is broken, it becomes a level of support.
How can I find support and resistance?
There’s a wide range of tools and analytical methods that help in identifying levels of support and resistance, which include:
- Previous tops and bottoms
- Candlestick patterns
- Moving averages
- Trend lines
- Bollinger Bands
- Fibonacci retracements
Let’s focus on a few examples based on the list above:

Here we have a US500 chart, where a trend line has been formed. This trend line acted as a support level, not allowing the market to break below. In this example, traders will be confident that prices are likely to remain above this trend line support.
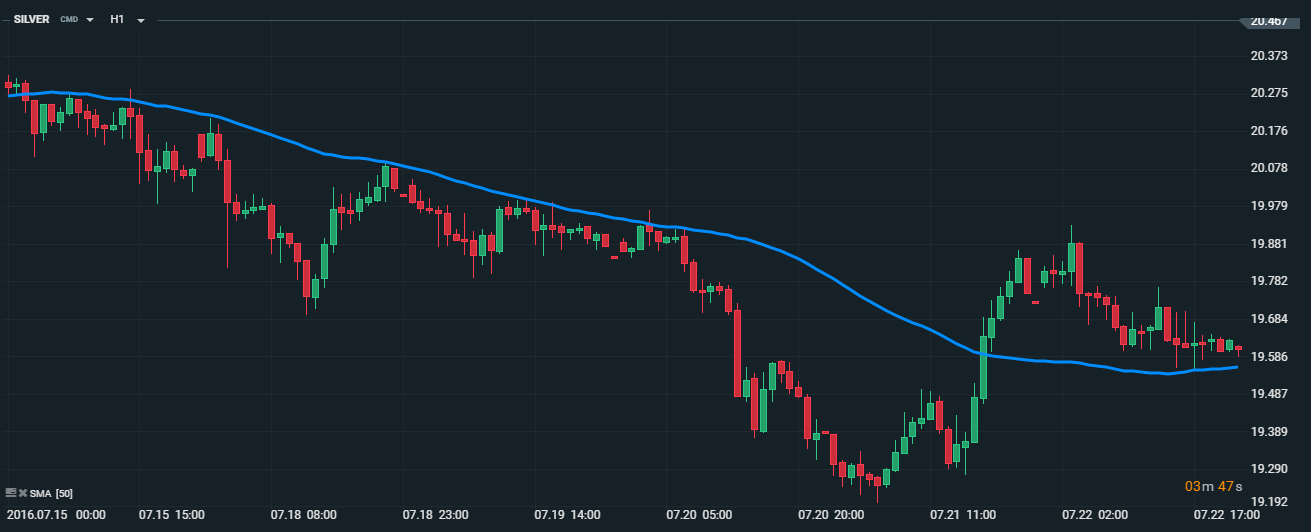
This example shows a Simple Moving Average applied on the Silver market. As you can see, the SMA initially acted as a significant level of resistance for the market, but once it was broken became a level of support.

This is an example on the USDCHF currency pair, where you can see that the highest top acted as a significant level of resistance. The market approached this level on four occasions, breaking it only with a shadow of a candlestick rather than with the full body indicating weakness.
In conclusion, there is a very wide variety of methods indicating levels of support and resistance, and to some extent technical analysis may be interpreted as the analysis of support and resistance levels.


This content has been created by XTB S.A. This service is provided by XTB S.A., with its registered office in Warsaw, at Prosta 67, 00-838 Warsaw, Poland, entered in the register of entrepreneurs of the National Court Register (Krajowy Rejestr Sądowy) conducted by District Court for the Capital City of Warsaw, XII Commercial Division of the National Court Register under KRS number 0000217580, REGON number 015803782 and Tax Identification Number (NIP) 527-24-43-955, with the fully paid up share capital in the amount of PLN 5.869.181,75. XTB S.A. conducts brokerage activities on the basis of the license granted by Polish Securities and Exchange Commission on 8th November 2005 No. DDM-M-4021-57-1/2005 and is supervised by Polish Supervision Authority.