
- Fibonacci retracement levels use horizontal lines to indicate where possible support and resistance levels are.
- The number of people who use this technique has increased significantly in recent years.
- Many well-known professional traders use Fibonacci retracement levels, including Robert Miner, Bryce Gilmore and Scott Carney.
What Is a Fibonacci Retracement?
A Fibonacci retracement refers to areas of support and resistance. Fibonacci retracement levels use horizontal lines to indicate where possible support and resistance levels are. These levels are associated with a percentage, and these percentages, or levels, are the following:
76.4%, 61.8%, 38.2% and 23.6%
This article briefly explains what is so significant about these percentages, why the Fibonacci sequence can be a useful tool in trading, and how to use Fibonacci retracement.
Origins of Fibonacci Levels
Fibonacci levels are derived from a number sequence that was first introduced by an Italian mathematician, Leonardo of Pisa (1180-1250), who later became known as Fibonacci. The sequence starts like this:
0, 1, 1, 2, 3, 5, 8, 13, 21, 34, 55, 89…
Each new number is the sum of the two numbers before it, and as the sequence progresses, each number is approximately 61.8% of the next number, 38.2% of the following number, and 23.6% of the number after that. If you subtract 23.6 from 100, the result is 76.4.
These are also our Fibonacci retracement levels: 76.4, 61.8, 38.2 and 23.6. While not officially a Fibonacci ratio, 50 is sometimes also used in trading.
What’s most interesting about this sequence is that it often occurs in natural shapes as well, such as in seashells, flowers and even constellations. The Fibonacci sequence is also strongly related to the golden ratio.
Some scholars have come to believe that these ratios even predict human behaviour, thinking that people start to become uncomfortable with trends that cause changes to happen too quickly, and adjust their own behaviour to slow down the trend.
Fibonacci Retracement in Trading
As you can imagine, this knowledge can turn out to be very useful in trading. For example, when a stock is trending very strongly in one direction, according to the Fibonacci theory, the pullback is likely to amount to one of the Fibonacci percentages (23.6, 38.2, 61.8, or 76.4).
How to Use Fibonacci Retracement
There are many ways to use Fibonacci retracement, but in this article we will focus mainly on comparing corrections to impulses. Fibonacci retracement is often used as a tool to inform traders where the correction may end, and where they can open transactions in the direction of the trend, hopefully achieving market advantage.
Some of the more significant levels of support and resistance are the following:
- 38.2% - 41.4%
- 50%
- 61.8% - 70.7%
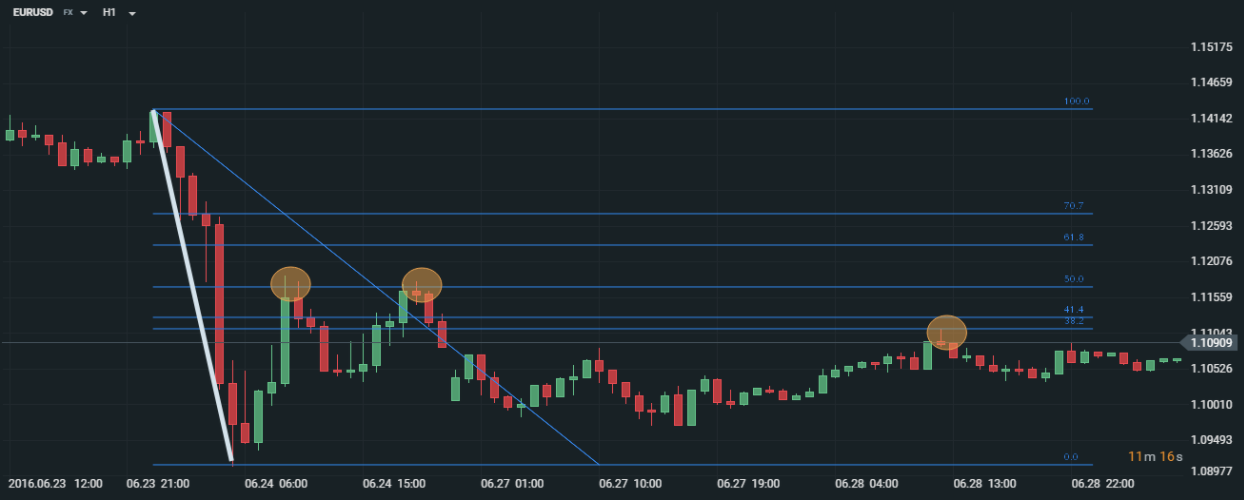
Source: xStation
Please be aware that the presented data refers to the past performance data and as such is not a reliable indicator of future performance.
In the example above, the market began a dynamic decline, then began to increase in value, stopping twice at 50% lift, and then tested the lift again at 38.2%. This is a great example showing that the market could not break these significant levels three times.
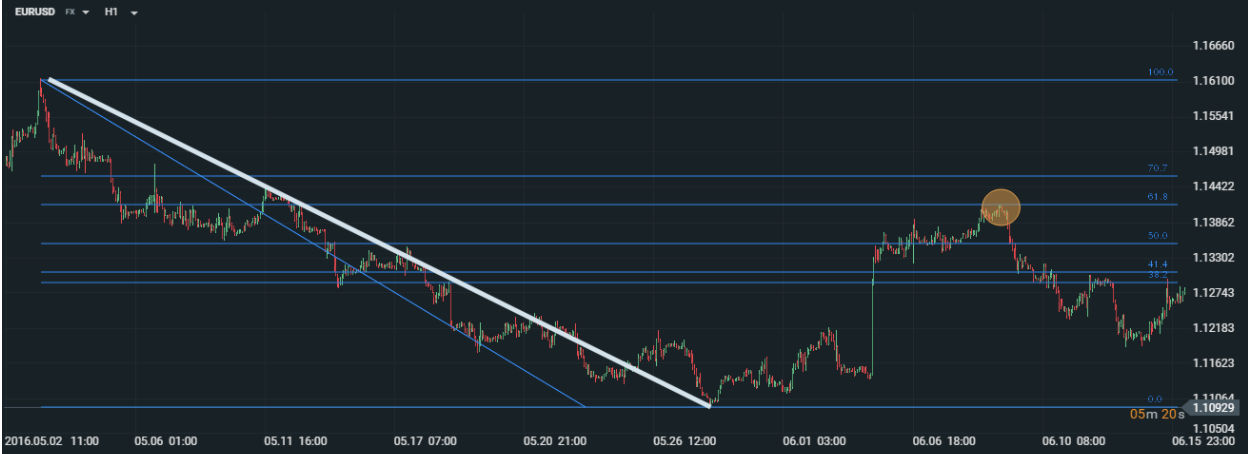
Source: xStation
Please be aware that the presented data refers to the past performance data and as such is not a reliable indicator of future performance.
In this example, we again start with a decrease, and continue with increases, but they are much larger compared to the previous example. The EURUSD pair found resistance with 61.8% lifting of the downward move.
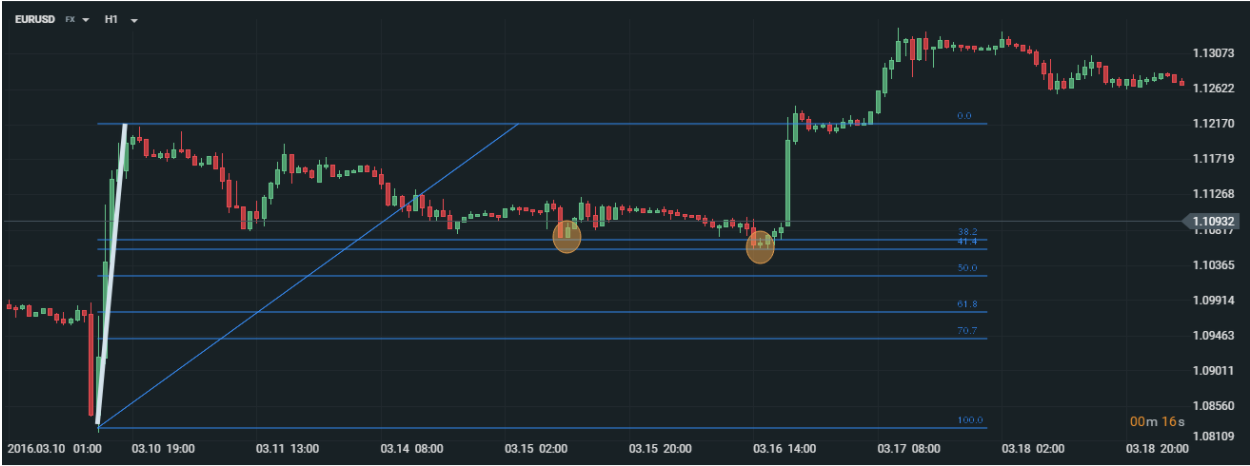
Source: xStation
Please be aware that the presented data refers to the past performance data and as such is not a reliable indicator of future performance.
Contrary to the last two examples, the market gained value first, and then the correction movement began to form. Before continuing the upward movement towards the main trend, the market found support at the first lift, 38.2%, and then again at 41.4%.

This content has been created by XTB S.A. This service is provided by XTB S.A., with its registered office in Warsaw, at Prosta 67, 00-838 Warsaw, Poland, entered in the register of entrepreneurs of the National Court Register (Krajowy Rejestr Sądowy) conducted by District Court for the Capital City of Warsaw, XII Commercial Division of the National Court Register under KRS number 0000217580, REGON number 015803782 and Tax Identification Number (NIP) 527-24-43-955, with the fully paid up share capital in the amount of PLN 5.869.181,75. XTB S.A. conducts brokerage activities on the basis of the license granted by Polish Securities and Exchange Commission on 8th November 2005 No. DDM-M-4021-57-1/2005 and is supervised by Polish Supervision Authority.