
Stocks are a sea of red today, and volatility has picked up, as investors fear that the ‘September effect’ is impacting markets.
The S&P 500 is down by more than 1%, and the sell off is broad based, with all sectors of the index in the red on Thursday. The decline is being led by the financial sector, industrials and tech.
Only 48 stocks are higher today, including PepsiCo after news that activist investor Elliott had amassed a $4bn stake in the company to push through strategic change. The weakest performers include Goldman Sachs, Kraft Heinz and Constellation Brands.
September is seasonally a weak month for stocks, and the average decline in the last 5 years is 4.17%. Thus, some of today’s sell off could be seasonal, as there is no single driver that is weighing on risky assets and pushing investors towards safe havens like gold and the dollar.
Why the sell off could be limited, for now
The Vix, which has jumped on Tuesday, is not at particularly elevated levels, it is still below 20. Added to this, the bond market sell-off is also broad based, with yields jumping in the US and across Europe. This suggests it could be a temporary spike in volatility as the market braces for a tough few weeks, with political drama in France and the UK, along with the continued fallout from Donald Trump’s tariffs and the President’s ongoing dispute with the Federal Reserve.
From a technical perspective, the S&P 500 is testing the 6,400 level. If the sell-off gains pace in the coming hours and days, then good support lies at 6,324, the 50-day moving average, as you can see below. As long as we remain above this level then momentum could be to the upside, while a break below here could signal further weakness is on the cards.
Markets can think themselves lower
The bigger problem for markets right now is psychological. After a strong earnings season and upward revisions helped to drive gains in stocks in August, there are not many concrete drivers to push stocks forward in the next few weeks, so the market may instead focus on the pitfalls ahead.
Thus, it is worth investors bracing themselves for a rough few weeks, which is typical of September’s market behavior.
Chart 1: S&P 500 12-month chart, candlestick chart with moving averages.
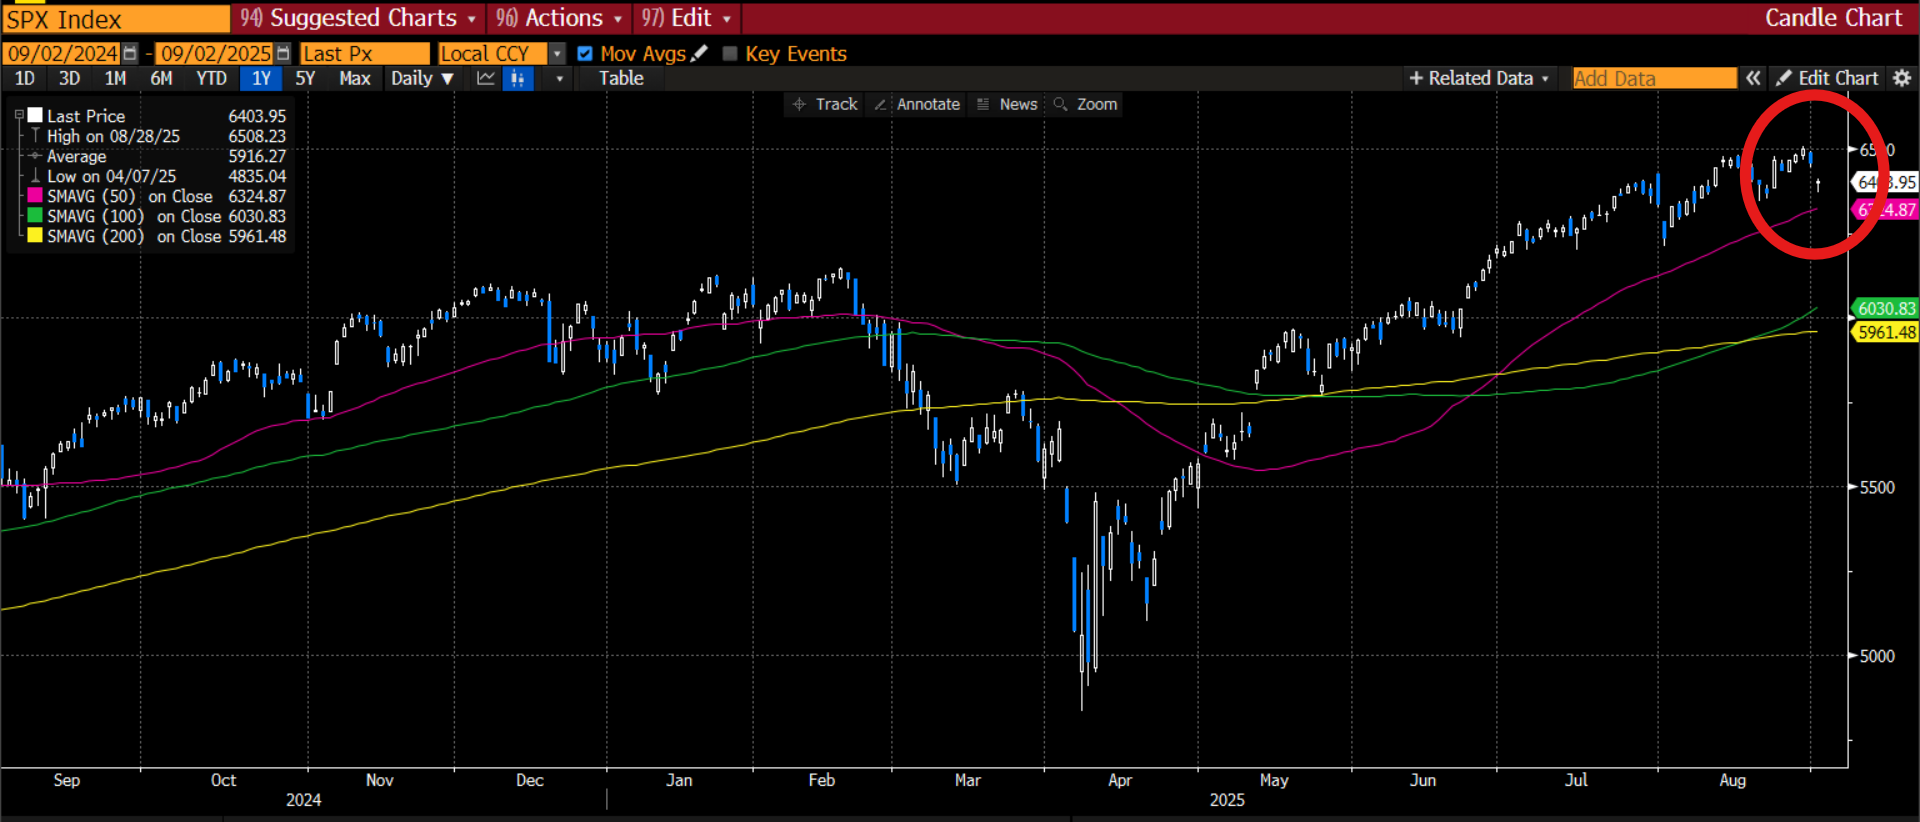
Source: XTB and Bloomberg

Daily Summary: Will the S&P 500 close the week with a loss❓Find out what drove the market today ⬇️

Three Markets to Watch Next Week: EURUSD, Gold, S&P 500 (26.06.2026)

Fed's Kashkari says AI will force a rate hike; EURUSD and USD reverse early moves ❗

University of Michigan sentiments lower than expected
This content has been created by XTB S.A. This service is provided by XTB S.A., with its registered office in Warsaw, at Prosta 67, 00-838 Warsaw, Poland, entered in the register of entrepreneurs of the National Court Register (Krajowy Rejestr Sądowy) conducted by District Court for the Capital City of Warsaw, XII Commercial Division of the National Court Register under KRS number 0000217580, REGON number 015803782 and Tax Identification Number (NIP) 527-24-43-955, with the fully paid up share capital in the amount of PLN 5.869.181,75. XTB S.A. conducts brokerage activities on the basis of the license granted by Polish Securities and Exchange Commission on 8th November 2005 No. DDM-M-4021-57-1/2005 and is supervised by Polish Supervision Authority.