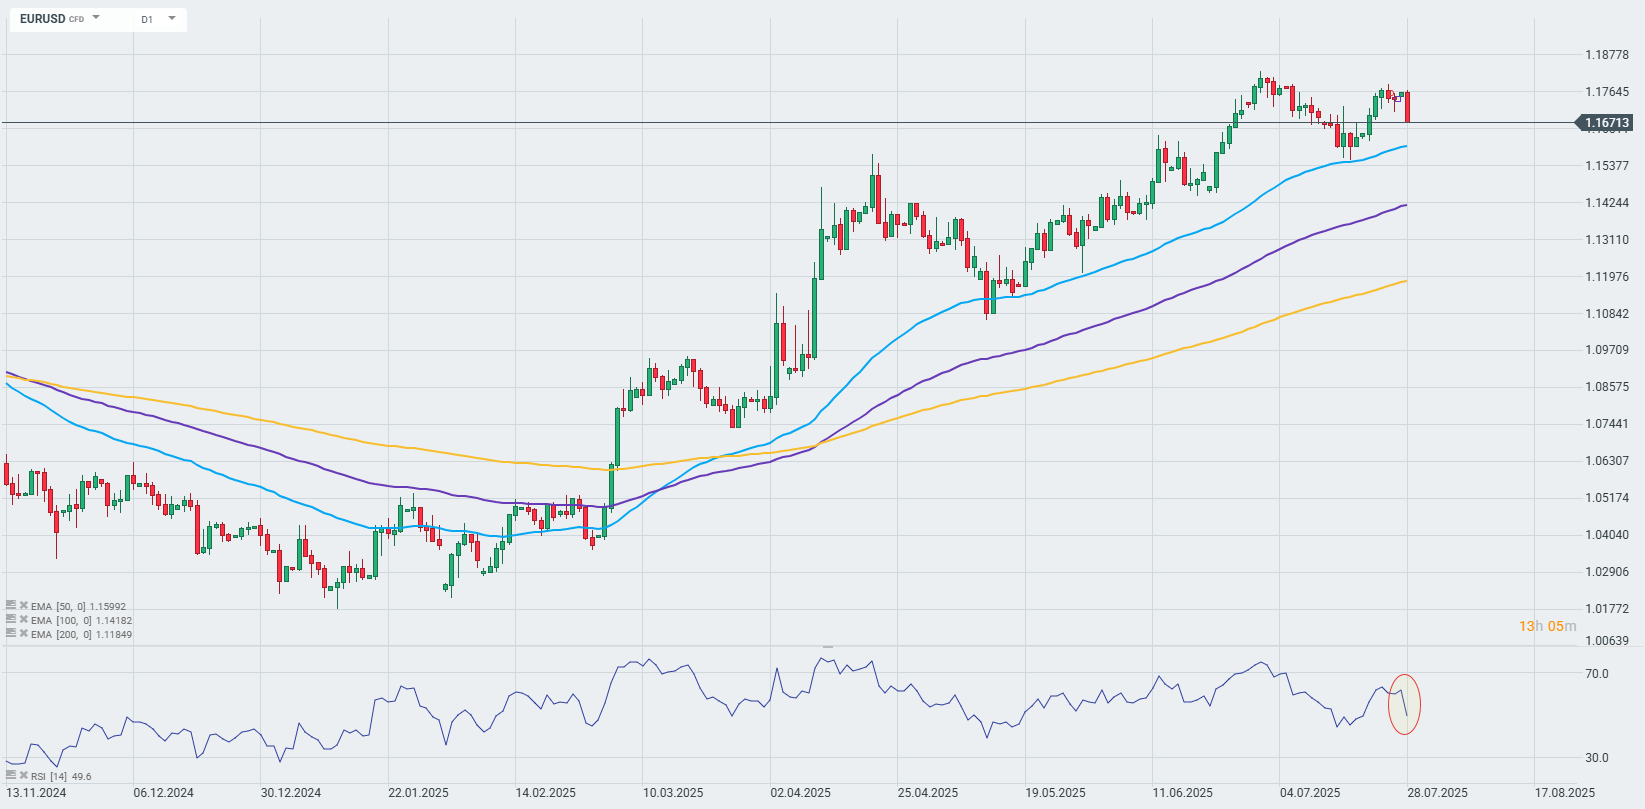
Following the announcement of a preliminary trade agreement between the United States and the European Union, the EUR/USD exchange rate fell and the US dollar strengthened significantly. Markets reacted to the agreement, which imposes a fixed 15% tariff on EU goods imported into the United States and commits the EU to purchasing $750 billion worth of US energy and investing an additional $600 billion in the US economy, increasing demand for the dollar. The USD had previously weakened significantly due to uncertainty over President Trump's trade policy, but the agreement is seen as mainly reducing the risk on the US side, thus helping to reverse the dollar's fortunes. In addition, the EUR/USD fell to 1.1670 at the start of the session, a move reinforced by the belief that trade risks in the US have diminished, while European exporters face additional barriers and future details remain unresolved.
In practice, the agreement also clarifies the tariff structure for strategic sectors: a 15% rate will apply to exports of semiconductors from the EU to the US, while a 0% tariff will apply to the exchange of semiconductor equipment in both directions, which is in line with earlier comments from the European side. The list of products covered by the zero tariff rate additionally includes aircraft and parts, certain chemicals, generic drugs, key agricultural products, and critical natural resources — although officials emphasize that this requires further negotiation, especially for products such as alcoholic beverages. Despite the framework nature of the agreement, it has reduced immediate uncertainty surrounding transatlantic trade, causing the dollar to strengthen as previous risk premiums have faded. This reaction reflects market expectations that the agreement primarily protects US interests, while the euro faces ongoing structural challenges, putting pressure on the EUR/USD exchange rate in the short term.

Despite today's declines, the EURUSD pair remains in a stable (long-term) upward trend, looking at the 50-, 100- and 200-day exponential moving averages. Until the pair breaks below the 50-day EMA (blue curve on the chart), today's declines do not change the trend from a technical point of view. The 14-day RSI is falling to around 50 points (slightly elevated values, but within the average range).
Source: xStation

Daily Summary - Powerful NFP report could delay Fed rate cuts

BREAKING: Massive increase in US oil reserves!

US OPEN: Blowout Payrolls Signal Slower Path for Rate Cuts?

US jobs data surprises to the upside, and boosts stocks and pushes back Fed rate cut expectations
This content has been created by XTB S.A. This service is provided by XTB S.A., with its registered office in Warsaw, at Prosta 67, 00-838 Warsaw, Poland, entered in the register of entrepreneurs of the National Court Register (Krajowy Rejestr Sądowy) conducted by District Court for the Capital City of Warsaw, XII Commercial Division of the National Court Register under KRS number 0000217580, REGON number 015803782 and Tax Identification Number (NIP) 527-24-43-955, with the fully paid up share capital in the amount of PLN 5.869.181,75. XTB S.A. conducts brokerage activities on the basis of the license granted by Polish Securities and Exchange Commission on 8th November 2005 No. DDM-M-4021-57-1/2005 and is supervised by Polish Supervision Authority.


