


- The EURUSD pair fell to 1.1161 amid a crisis of confidence in French public finances.
- France proposed a controversial 2027 budget targeting €54 billion in cuts as public debt reaches 119% of GDP.
- French 10-year bond yields surged while the France-Germany spread exceeded 140 basis points.
- CFTC data shows speculative short contracts on the euro reached an all-time high.
- EURUSD trades below key moving averages with a medium-term bearish outlook targeting the 1.0950 – 1.1130 support zone.

- The EURUSD pair fell to 1.1161 amid a crisis of confidence in French public finances.
- France proposed a controversial 2027 budget targeting €54 billion in cuts as public debt reaches 119% of GDP.
- French 10-year bond yields surged while the France-Germany spread exceeded 140 basis points.
- CFTC data shows speculative short contracts on the euro reached an all-time high.
- EURUSD trades below key moving averages with a medium-term bearish outlook targeting the 1.0950 – 1.1130 support zone.
The euro is experiencing its worst day in weeks. The EURUSD pair fell to 1.1161, its lowest level since May 2025, following a fourth consecutive week of declines. The reason this time is not Fed policy, but a growing crisis of confidence surrounding French public finances, which is increasingly reminding investors of the scenario from the European debt crisis over a decade ago.
France in the Spotlight
Prime Minister Sébastien Lecornu presented a controversial draft budget for 2027, projecting €54 billion in cuts aimed at preventing a rating downgrade or default. The issue is that a minority government is unlikely to push it through without concessions, and France's public debt already stands at 119% of GDP. Yields on French 10-year bonds surged last week to their highest level since 2002, and the France-Germany yield spread exceeded 140 basis points. This is the largest weekly jump in 17 years and the highest level for this spread since 2012. The market is beginning to fear a contagion effect on the rest of the eurozone, similar to 2011–2012, which in theory could force the ECB to intervene in French debt. This represents the spectre of a debt crisis from the aforementioned period.
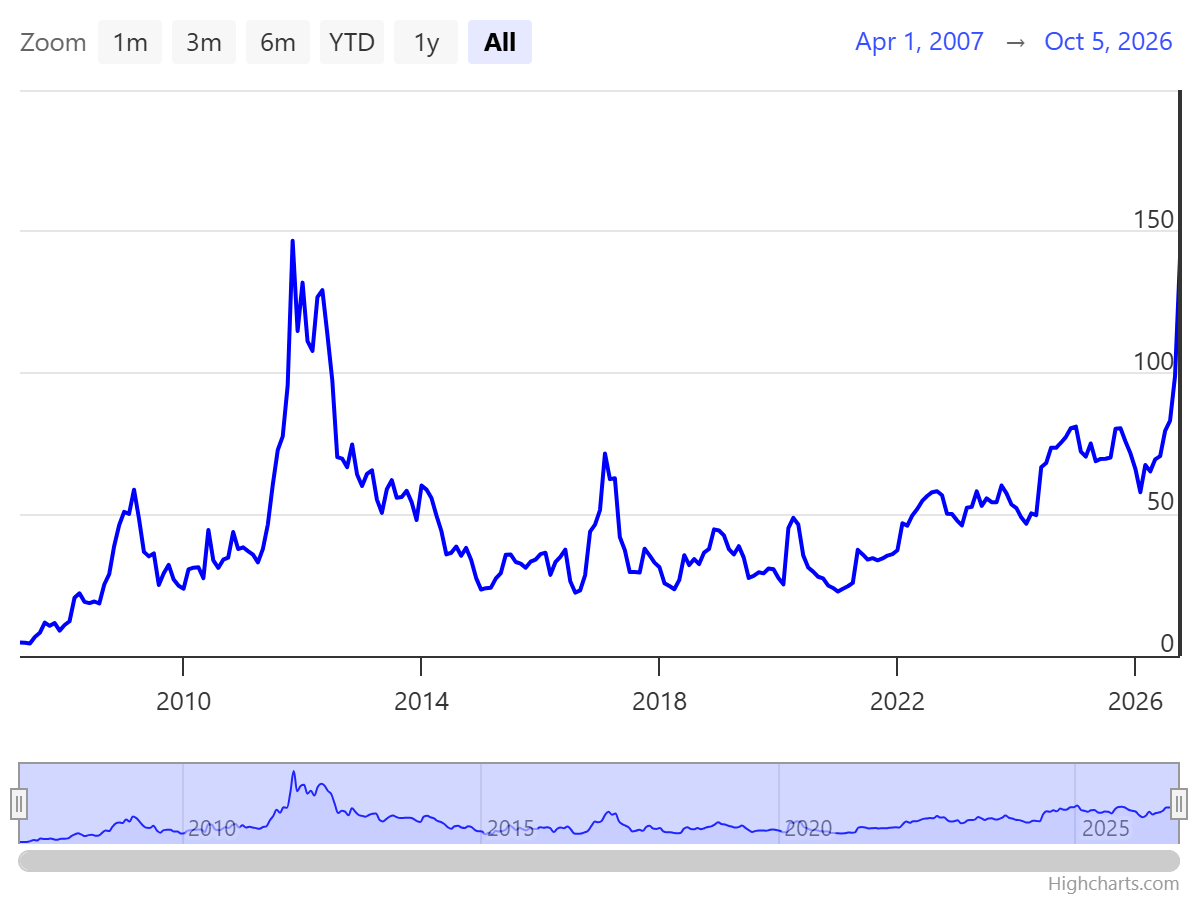 Source: World Government Bonds
The situation in Spain is not helping either, where political defeat for Pedro Sánchez's government raised signals of possible snap elections, adding to the general picture of political instability in the region.
Dollar Strong Despite Weaker US Data
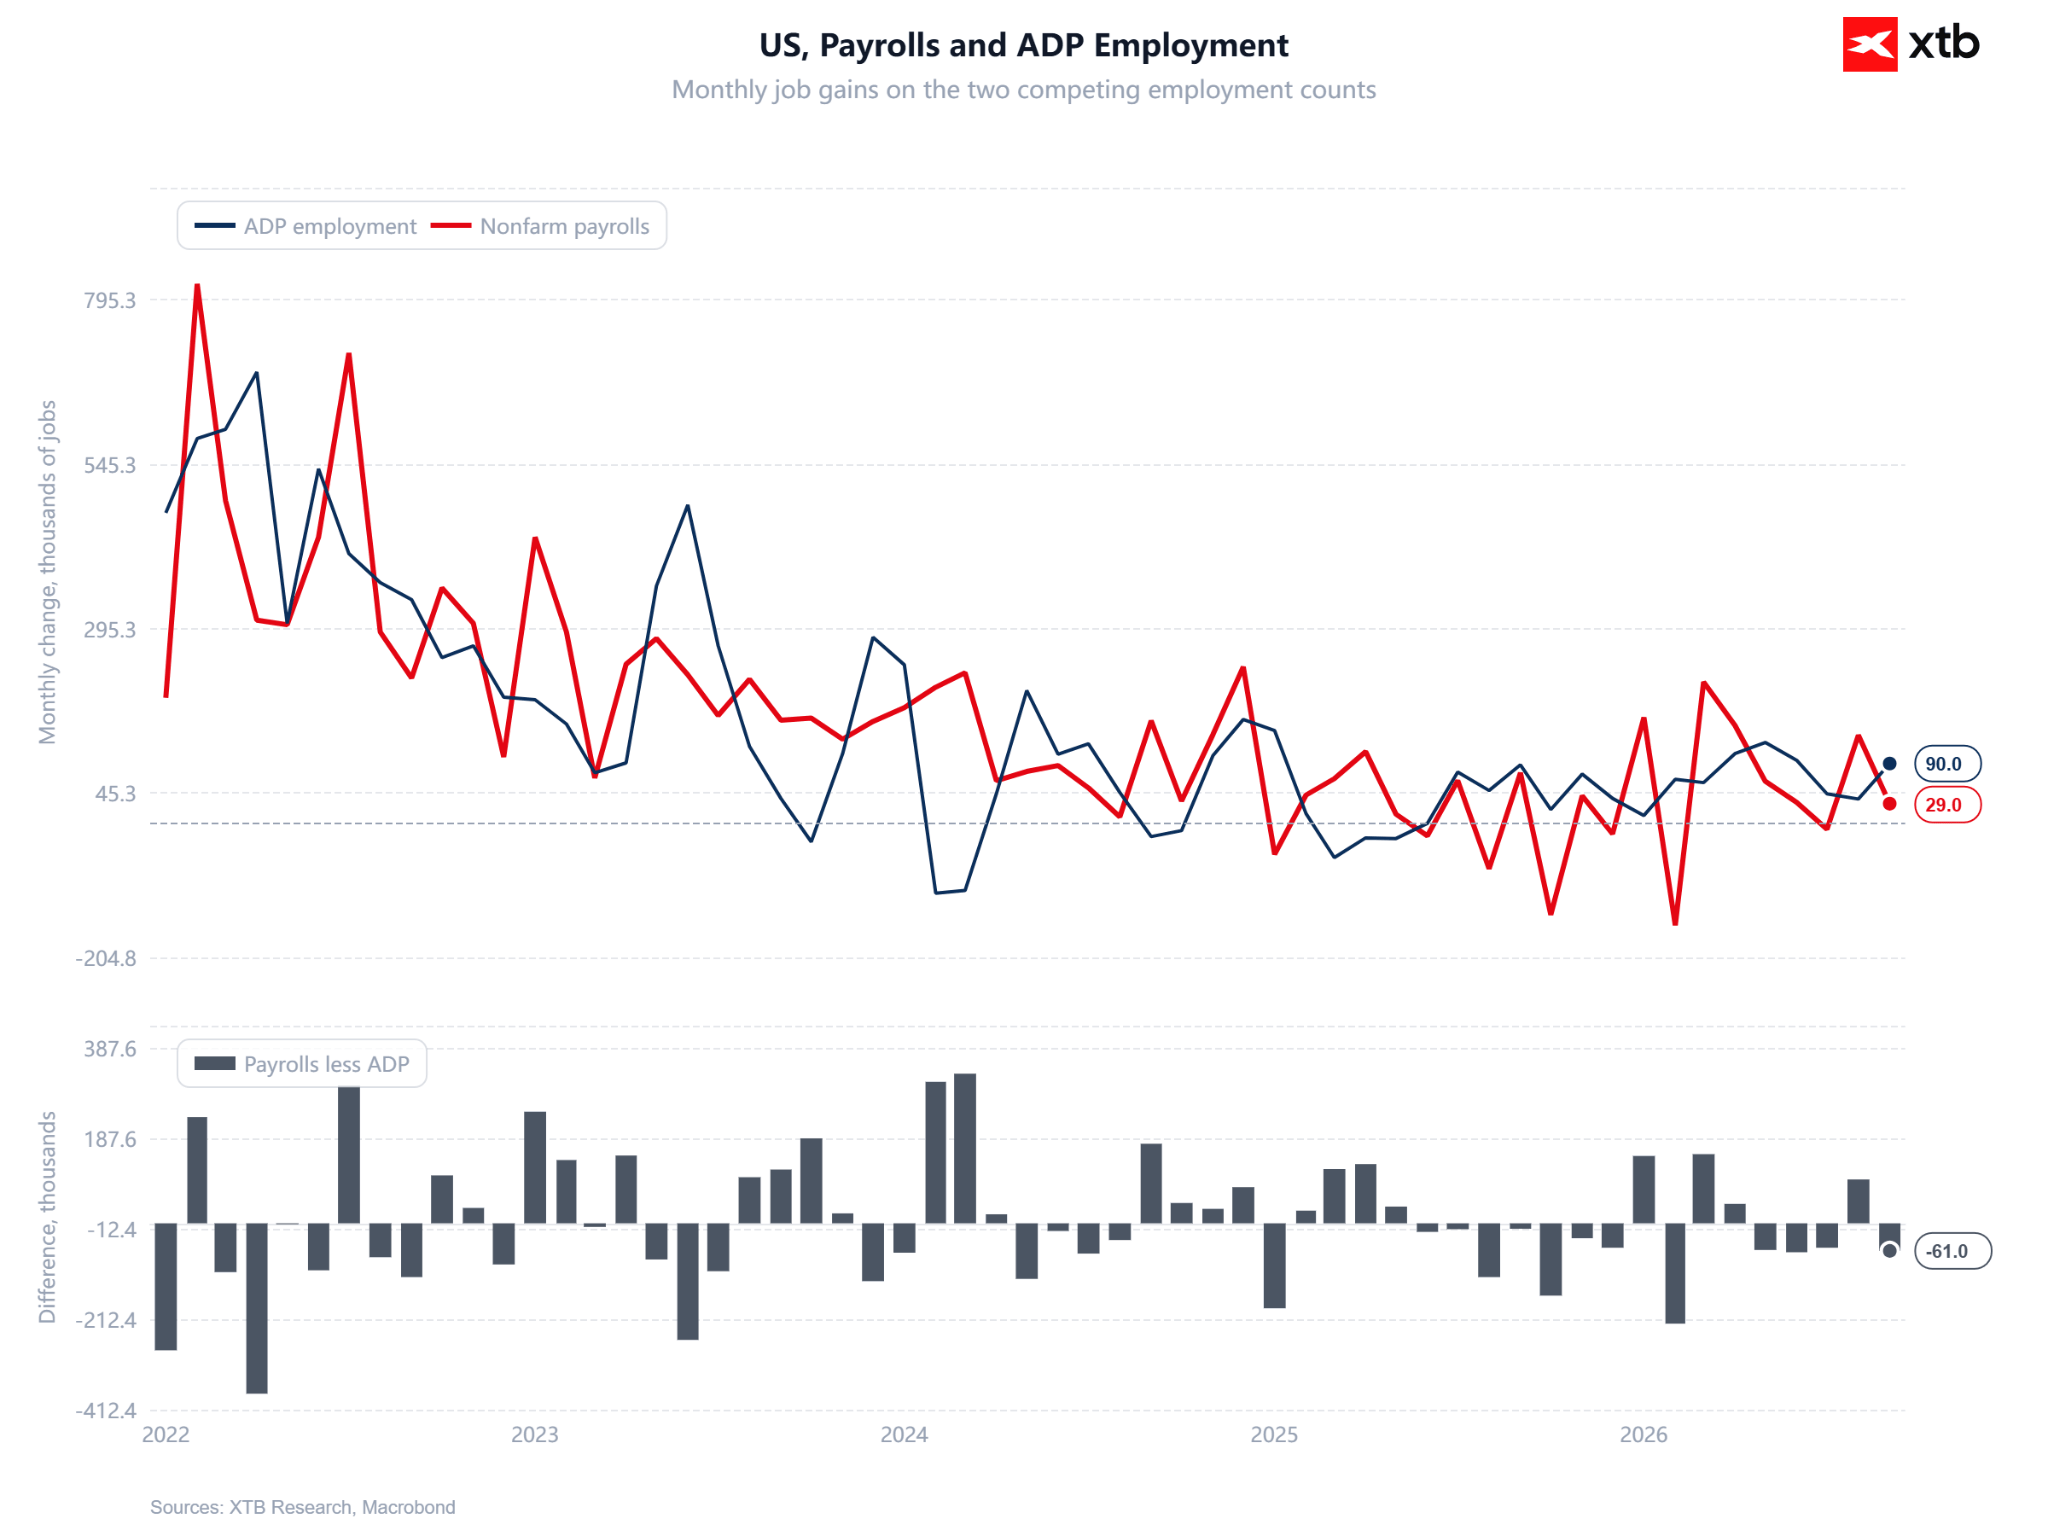
Paradoxically, a weaker-than-expected US labor market report did not aid the euro. The dollar is gaining on a flight-to-safety wave triggered by the sell-off in French debt, and the dollar index climbed to a new annual high. The market also pushed back Fed expectations: the probability of holding rates unchanged in October rose to nearly 78%, up from 36% just a week earlier.
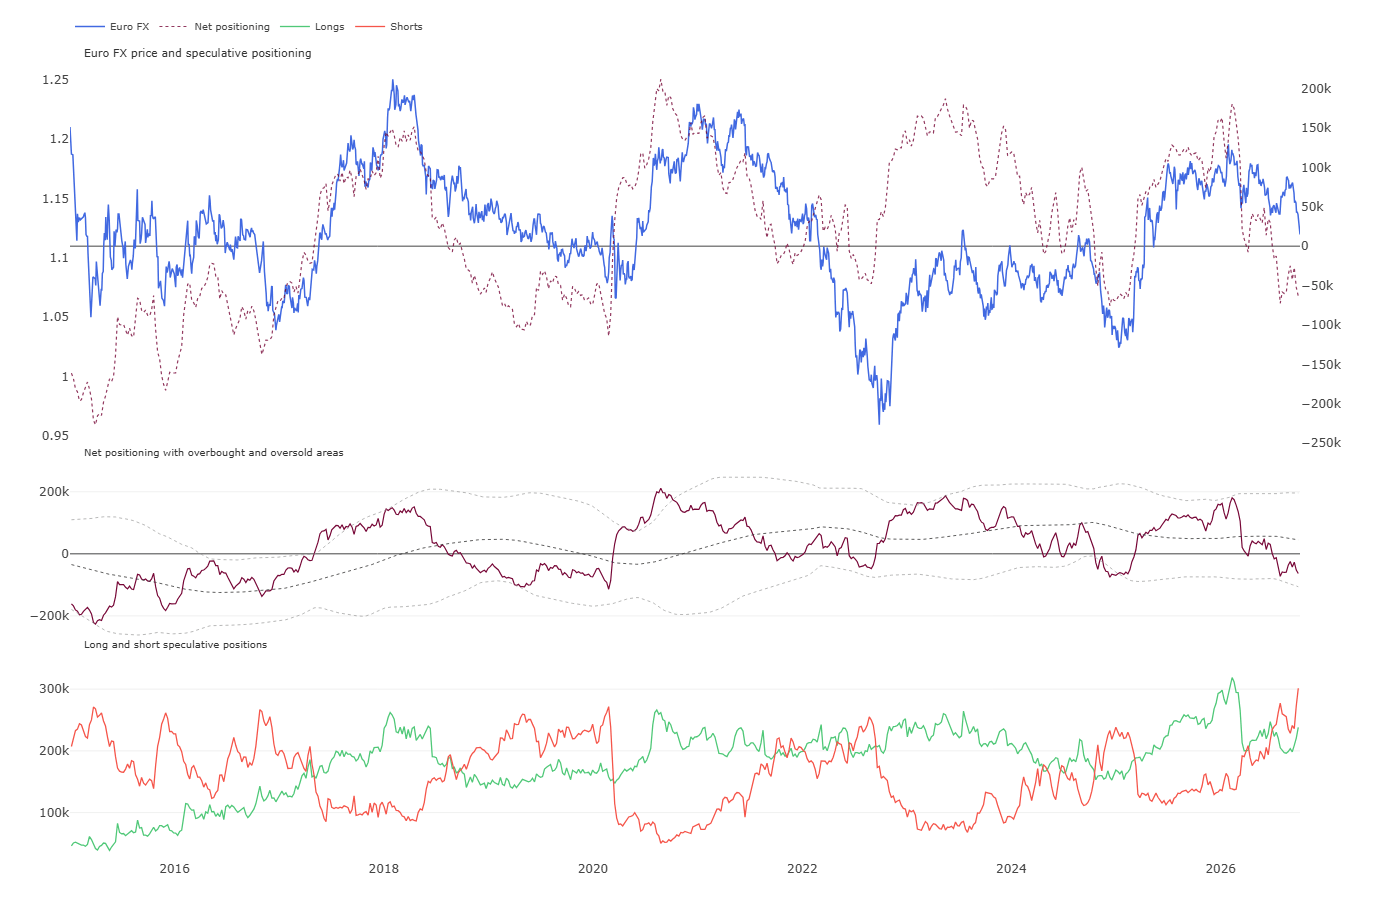
Euro Most Heavily Oversold in Positioning History
What sets the current move apart is the scale of speculative positioning. CFTC data shows that the number of short contracts on the euro reached an all-time high in this data series, exceeding even the peaks of 2011–2012. At the same time, net positioning slid deep into negative territory, though still not as low as during previous oversold waves in 2015 or 2022 — this time, the market is setting records specifically on the short side rather than on net positioning.
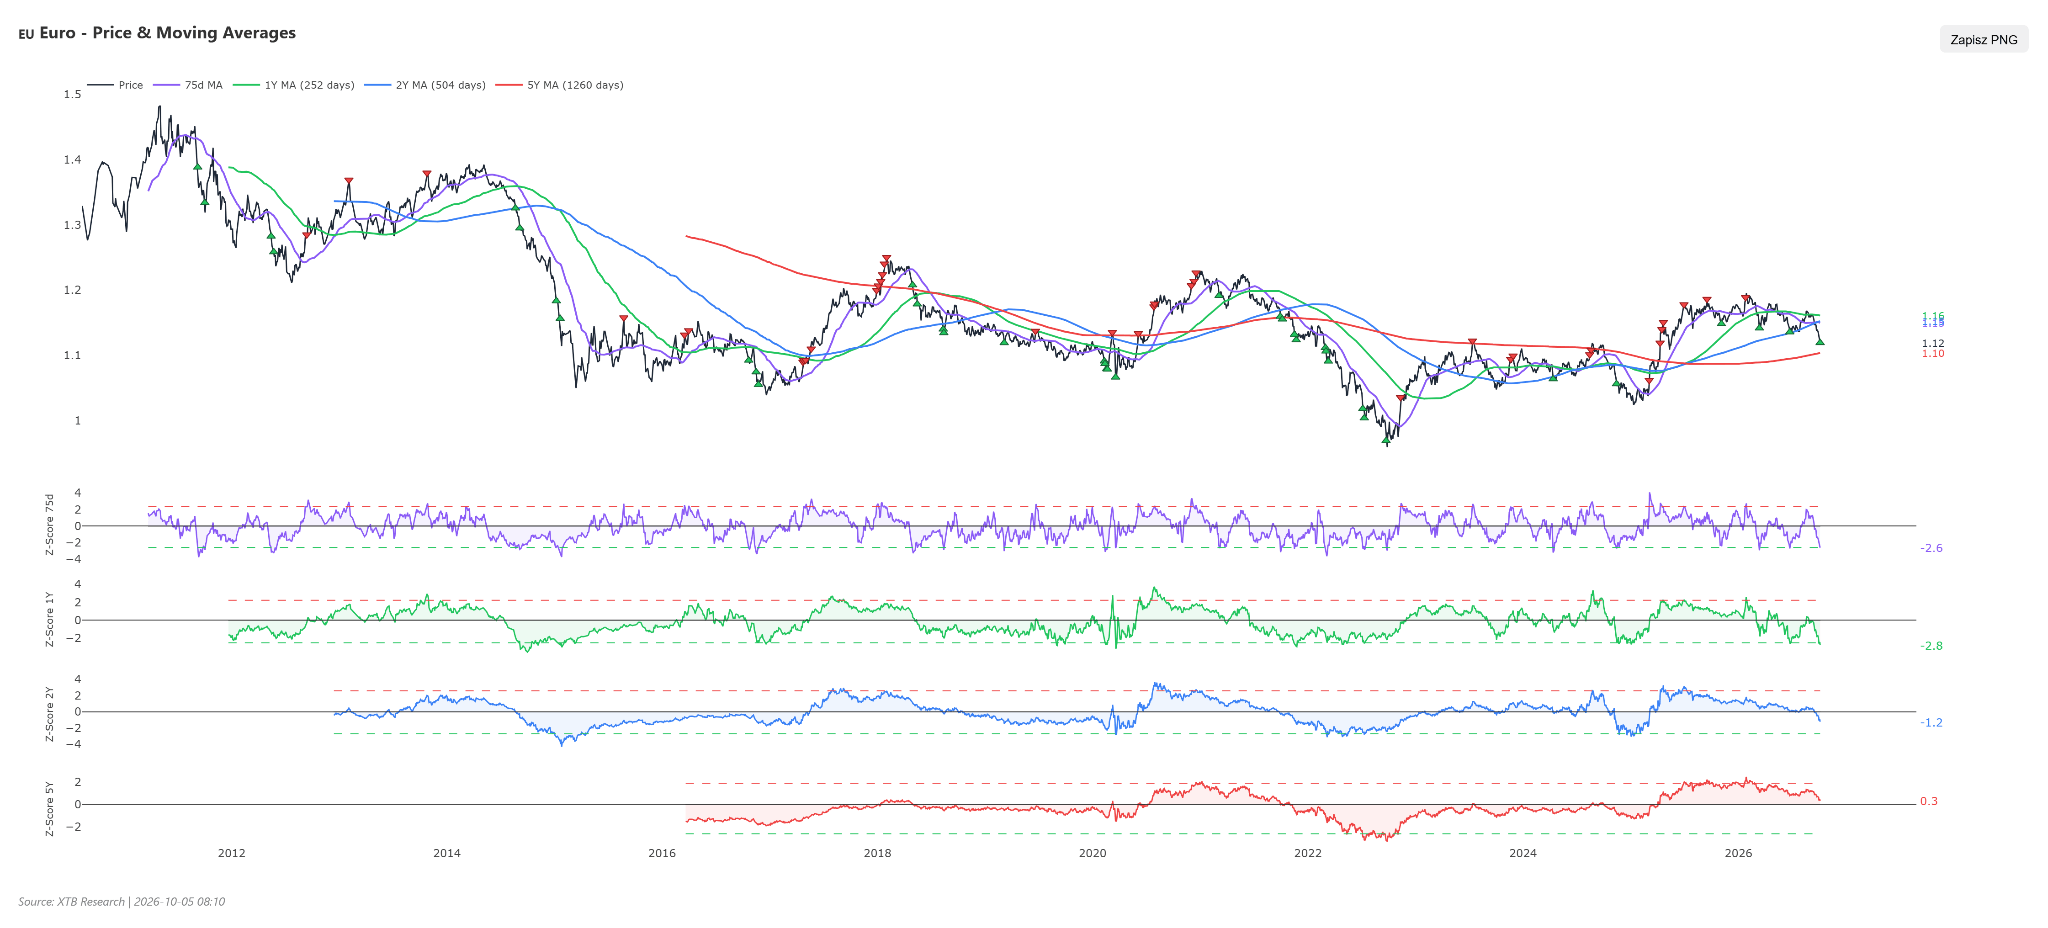
Contrarian Signals from Z-score
From a purely statistical perspective, the current sell-off appears extreme. The deviation of EURUSD from its 75-day moving average reaches a Z-score of -2.6, and from its 1-year average as much as -2.8, both readings clearly exceeding the -2 threshold considered the boundary of statistical oversold conditions. Over a longer horizon, the picture is calmer: the 2-year Z-score stands at -1.2, and the 5-year remains positive (+0.3), showing that despite the drama of recent sessions, the pair is still moving within its multi-year range. Such extreme short-term readings, combined with record short exposure in the market, have historically been a precursor to rebounds, though in the face of real fiscal risk rather than just sentiment, they should not be treated as a standalone signal to take positions against the trend.
EURUSD Technical Analysis on D1
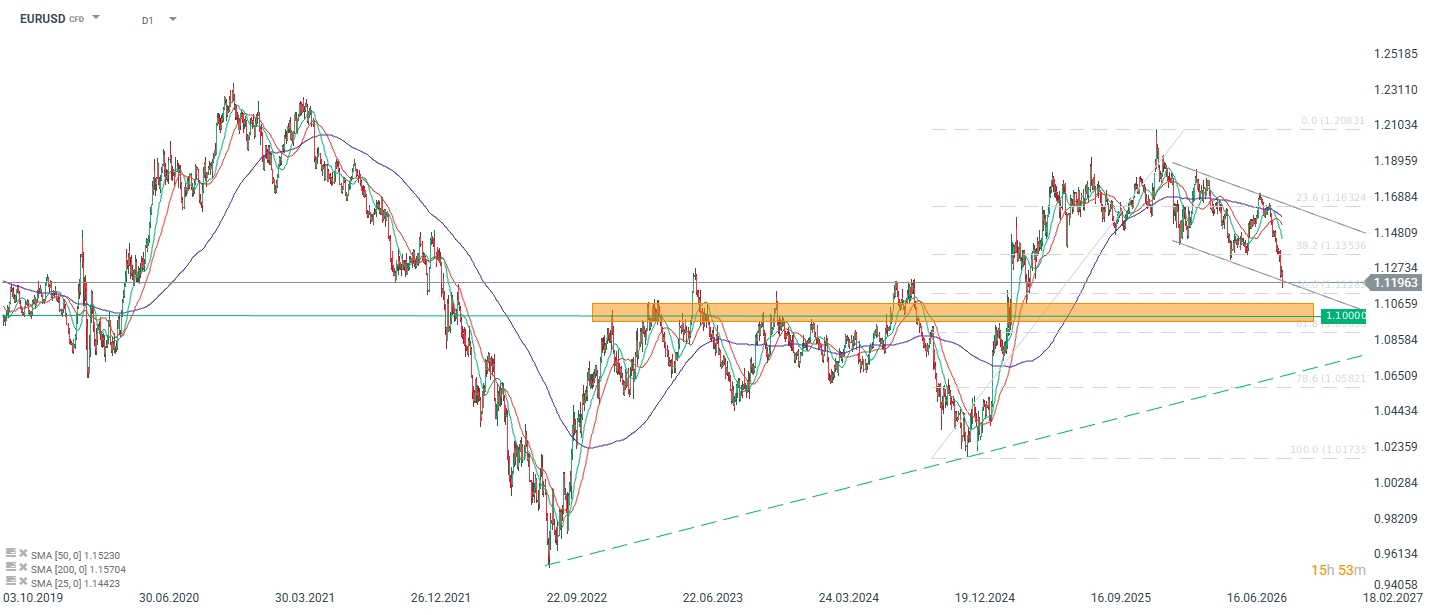
On the daily chart, EUR/USD is currently trading around 1.1196, amid an ongoing downward correction following an unsuccessful attempt to hold above the 2025 peak in the 1.1896–1.2083 area. Price has already broken through the 23.6% (1.16324) and 38.2% (1.13536) Fibonacci retracements, signaling a deeper-than-typical correction, and additionally trades below all three moving averages (SMA25, SMA50, SMA200) — the medium-term setup remains bearish. The key target area is the broad support zone at 1.0950–1.1130, which served as a multi-year equilibrium zone in 2023–2024, with the psychological 1.1000 level acting as its lower boundary. Only a breakout above the descending trendline would open the path toward a deeper recovery toward 1.1354–1.1632; otherwise, the dominant scenario remains a continuation of declines.



Daily Summary: Oil at five-month highs, indices under pressure (23.10.2026)


BREAKING: France slows down, Germany holds on. Euro falls below 1.12



Daily Summary: Valuations Under Pressure, Capital Moves Away From Technology

Market Wrap: "Decent" results are not enough – tech stocks fall further; oil highest since May (22.10.2026)
This content has been created by XTB S.A. This service is provided by XTB S.A., with its registered office in Warsaw, at Prosta 67, 00-838 Warsaw, Poland, entered in the register of entrepreneurs of the National Court Register (Krajowy Rejestr Sądowy) conducted by District Court for the Capital City of Warsaw, XII Commercial Division of the National Court Register under KRS number 0000217580, REGON number 015803782 and Tax Identification Number (NIP) 527-24-43-955, with the fully paid up share capital in the amount of PLN 5.869.181,75. XTB S.A. conducts brokerage activities on the basis of the license granted by Polish Securities and Exchange Commission on 8th November 2005 No. DDM-M-4021-57-1/2005 and is supervised by Polish Supervision Authority.