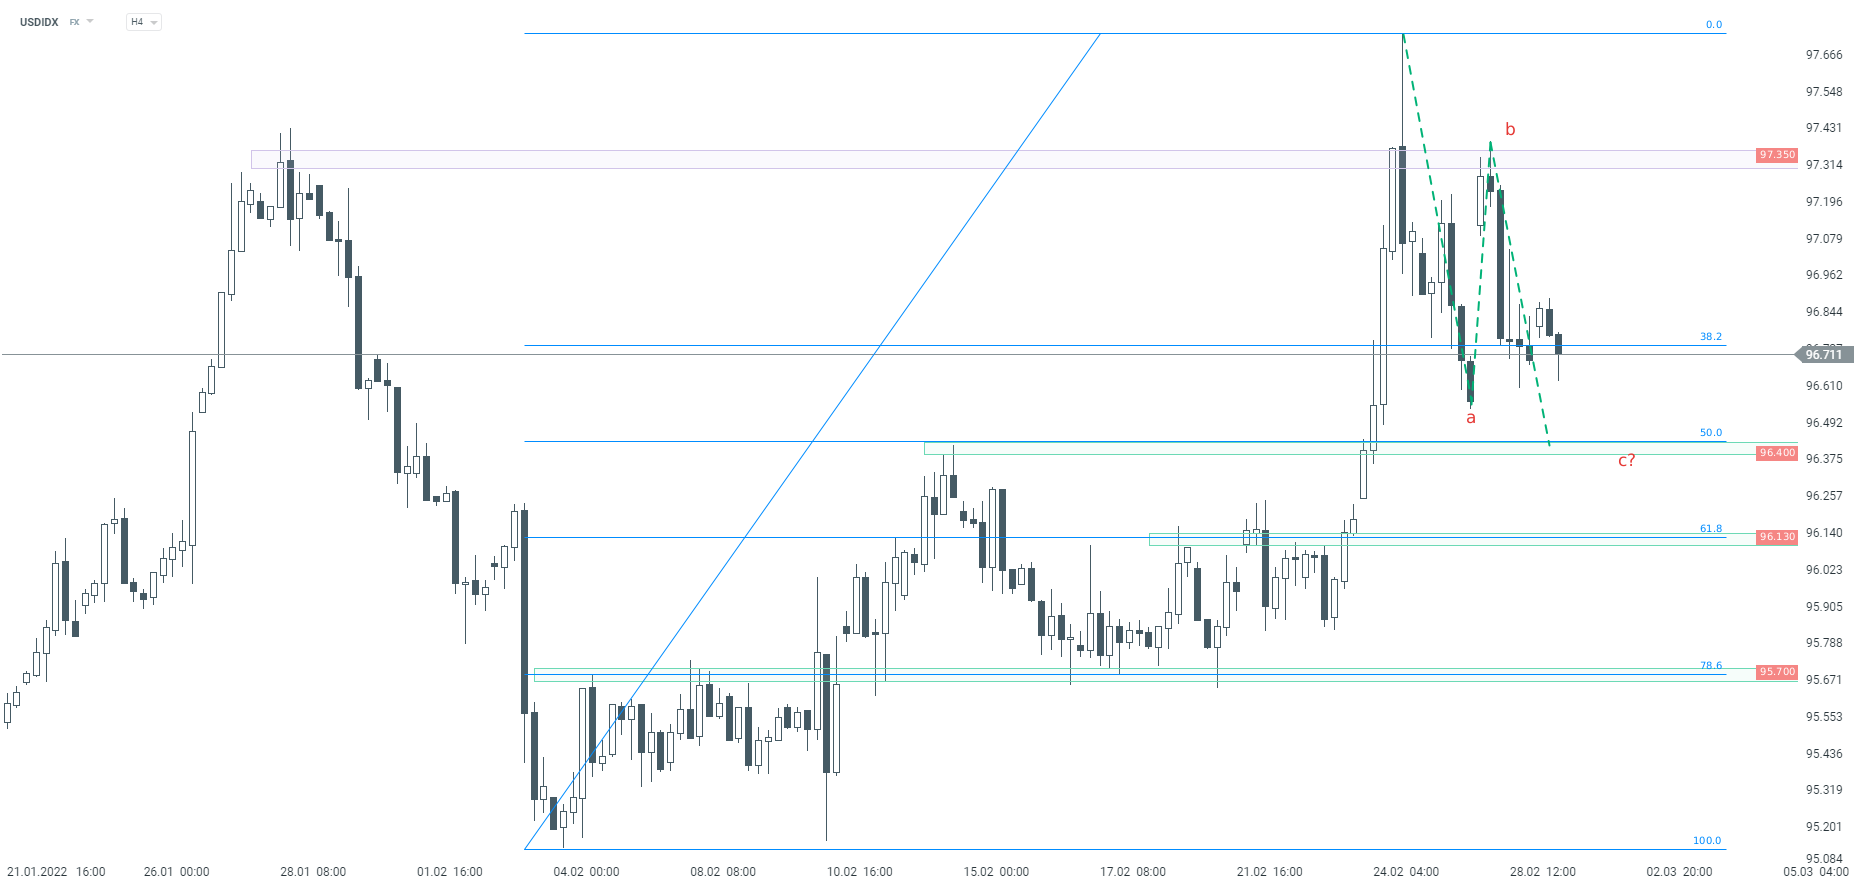
Launch of Russian invasion of Ukraine and accompanying pick-up in geopolitical tensions triggered a flight to safety last week. Those flows have slowed somewhat but assets like gold or US dollar continue to trade above pre-invasion levels. Taking a look at the US dollar index chart (USDIDX), we can see that the price spiked to 97.70 last week when the Russian invasion began but has given back part of gains later on. Subsequent pullback starts to look like an ABC correction and if the third leg of this pattern is executed in a textbook manner, USDIDX could drop to the 96.40 support area, which is marked with a 50% retracement of the upward impulse started at the beginning of February. However, before that happens, price needs to break below the 38.2% retracement that is being tested at press time (96.70).
 Source: xStation5

Three Markets Worth Watching Next Week (17.07.2026)

Netflix slumps, as SpaceX and chip stock sell off continues

EURUSD: Fed Pushback Keeps Dollar Supported Despite Softer Inflation Data

A win for England: first half growth on positive track, keeps pound buoyant
This content has been created by XTB S.A. This service is provided by XTB S.A., with its registered office in Warsaw, at Prosta 67, 00-838 Warsaw, Poland, entered in the register of entrepreneurs of the National Court Register (Krajowy Rejestr Sądowy) conducted by District Court for the Capital City of Warsaw, XII Commercial Division of the National Court Register under KRS number 0000217580, REGON number 015803782 and Tax Identification Number (NIP) 527-24-43-955, with the fully paid up share capital in the amount of PLN 5.869.181,75. XTB S.A. conducts brokerage activities on the basis of the license granted by Polish Securities and Exchange Commission on 8th November 2005 No. DDM-M-4021-57-1/2005 and is supervised by Polish Supervision Authority.