


Wheat prices are currently driven by various overlapping geopolitical risks and rapidly deteriorating global harvest prospects. Recent gains have clearly accelerated, and US wheat contract quotes have reached the 751.1 USD level, making it one of the absolute commodity market leaders recently.
How have wheat prices changed recently?
Wheat prices are in an uptrend. In the last session, they rose by 0.46%, weekly by 7.94%, and monthly by 13.61%. Since the beginning of the year, the increase has been 48.40%, while compared to the same period last year, the price is 42.08% higher.
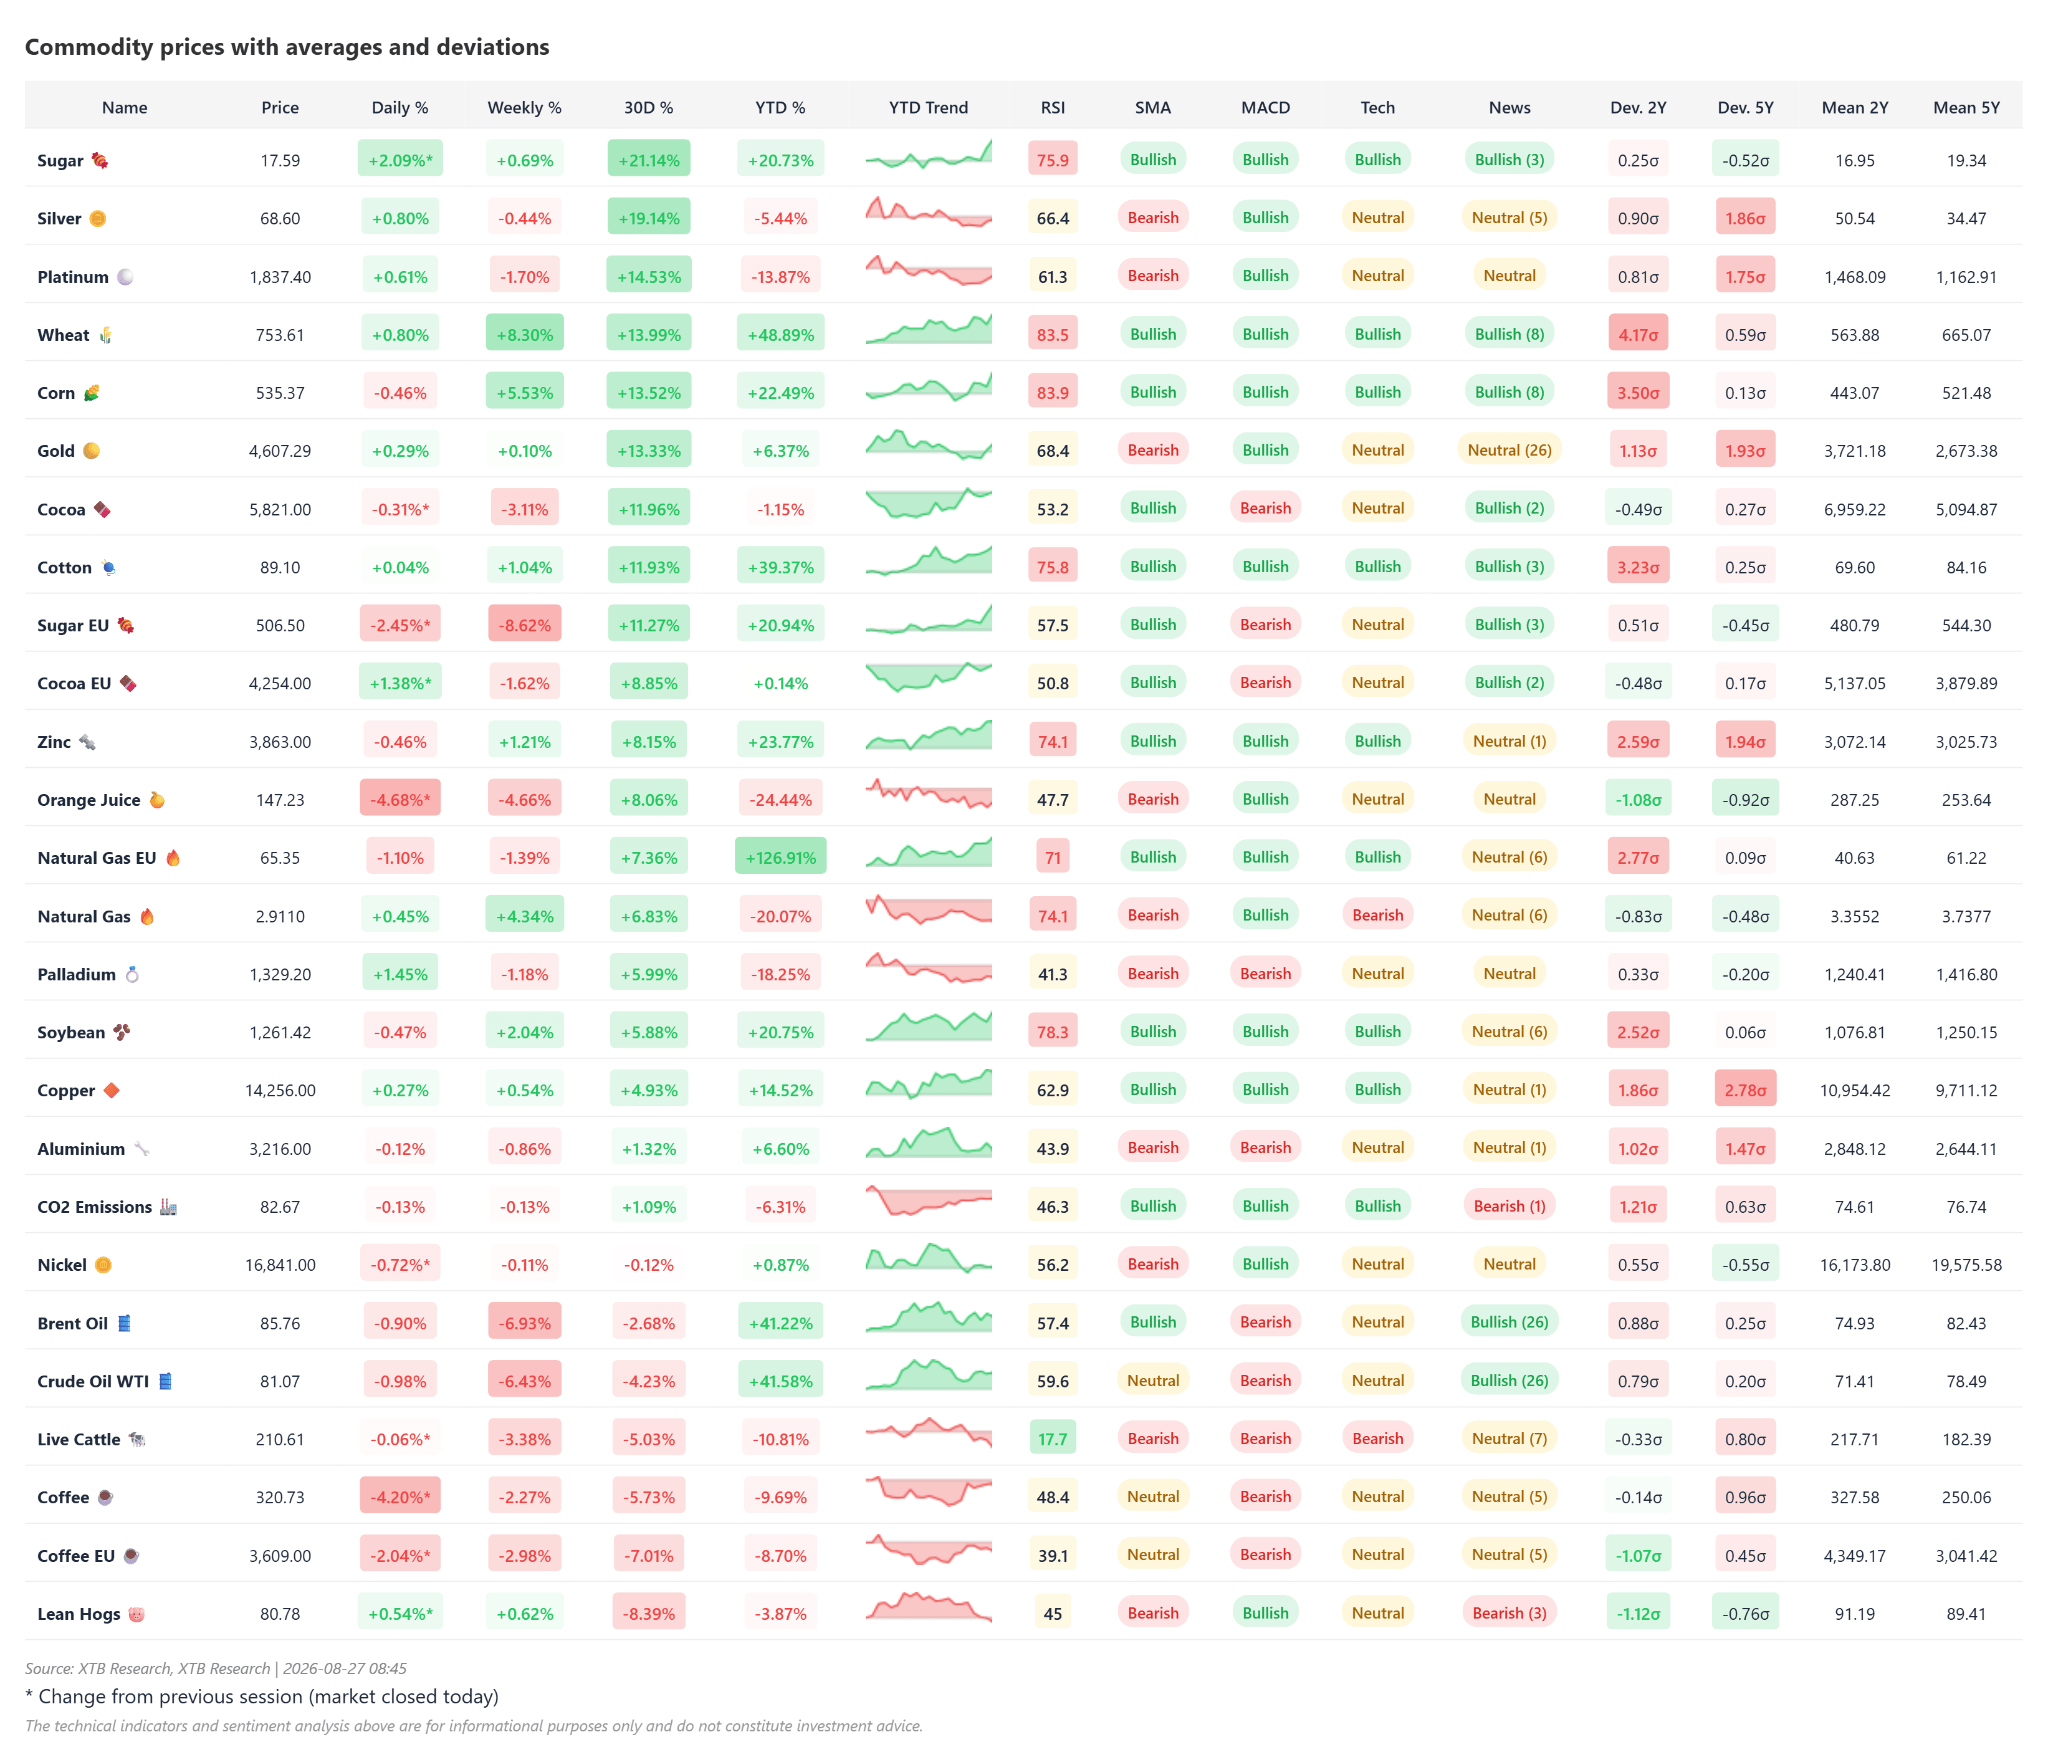 In terms of monthly changes in the agricultural commodity market, wheat is second only to sugar. Looking more broadly, silver and platinum are also gaining more strongly. Wheat is extremely overbought looking at the 2-year average and the RSI indicator. Source: XTB
Main drivers of wheat price growth
- Escalation in the Black Sea region: Fears of paralysis of export routes and destruction of port infrastructure in Ukraine have caused investor panic. On the Chicago (CBOT) and Kansas City (KC) exchanges, prices rose so sharply that they hit daily growth limits (45 cents), which forced the exchanges to extend the limits for subsequent sessions up to 70 cents.
- Putin's threats: Yesterday, information appeared about the planned escalation in Ukraine, which could disrupt exports and harvests. Ukraine is an important exporter of agricultural commodities such as corn, wheat, or sunflower oil.
- Quality problem in Europe: Heavy rains in France and Germany during the harvest have drastically reduced grain quality (a drop in EU soft wheat exports to just 2.38 million tons since July). Global importers have been forced to shift demand to North America.
- Weather pressure in the USA and Canada: Heat waves and droughts in key states (e.g., North Dakota) have damaged spring wheat crops, lowering the percentage of crops in 'good to excellent' condition and threatening a shortage of high-protein grain.
- Rising freight and inventories: Tensions on other routes (e.g., crisis in the Strait of Hormuz) are driving up transport insurance costs, while global ending stocks are shrinking to their lowest levels in years.
Technical analysis and extreme overbought
Although the moving average setup (price is 15.69% above SMA50) and the MACD indicator remain strongly bullish, the market is sending overheating signals. The RSI indicator has reached an extreme level of 83, which in the past has almost always heralded a correction.
Historical deviation Z-score indicators also signal increasing overvaluation – the 5-year Z5Y indicator has risen from -0.71 (half a year ago) to +0.57 now, completely erasing the previous price discount. Real overvaluation is visible, however, on lower averages like the 3-month average, or above all the 2-year average, where we already have 4 standard deviations from the average.
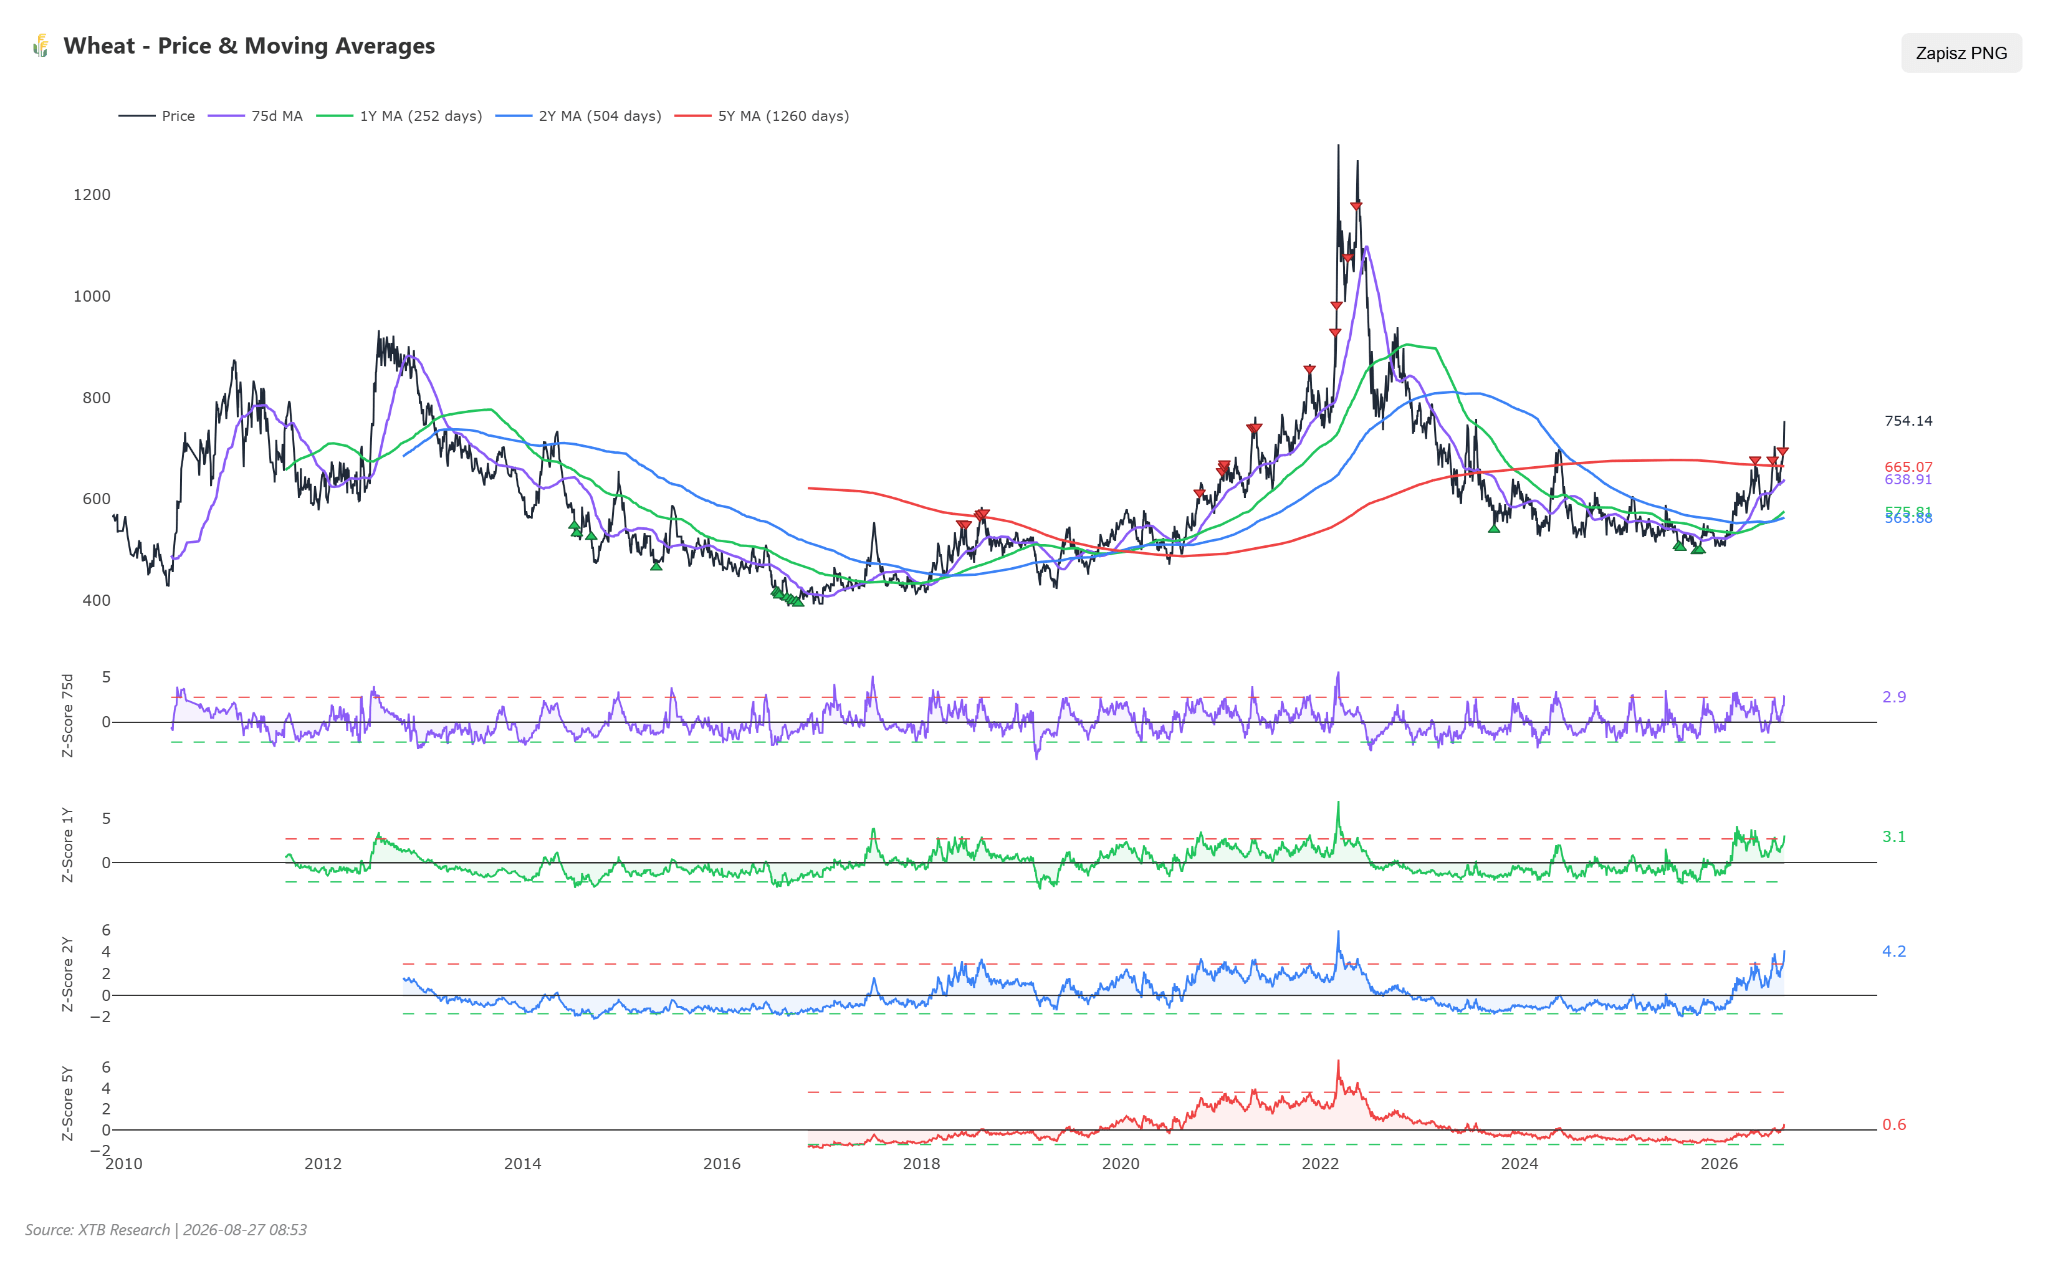 Relative to the 2-year average, wheat was this strongly deviated in 2022. Source: XTB
Market scenarios
- Bullish scenario: A sustained break of the 770–780 USD resistance will occur in the event of further attacks on Black Sea port infrastructure and official cuts to stock forecasts in subsequent USDA (WASDE) reports.
- Bearish scenario: Profit-taking and a drop to local supports will materialize if tensions in the east de-escalate and harvest forecasts in the southern hemisphere (Australia, Argentina) improve significantly.
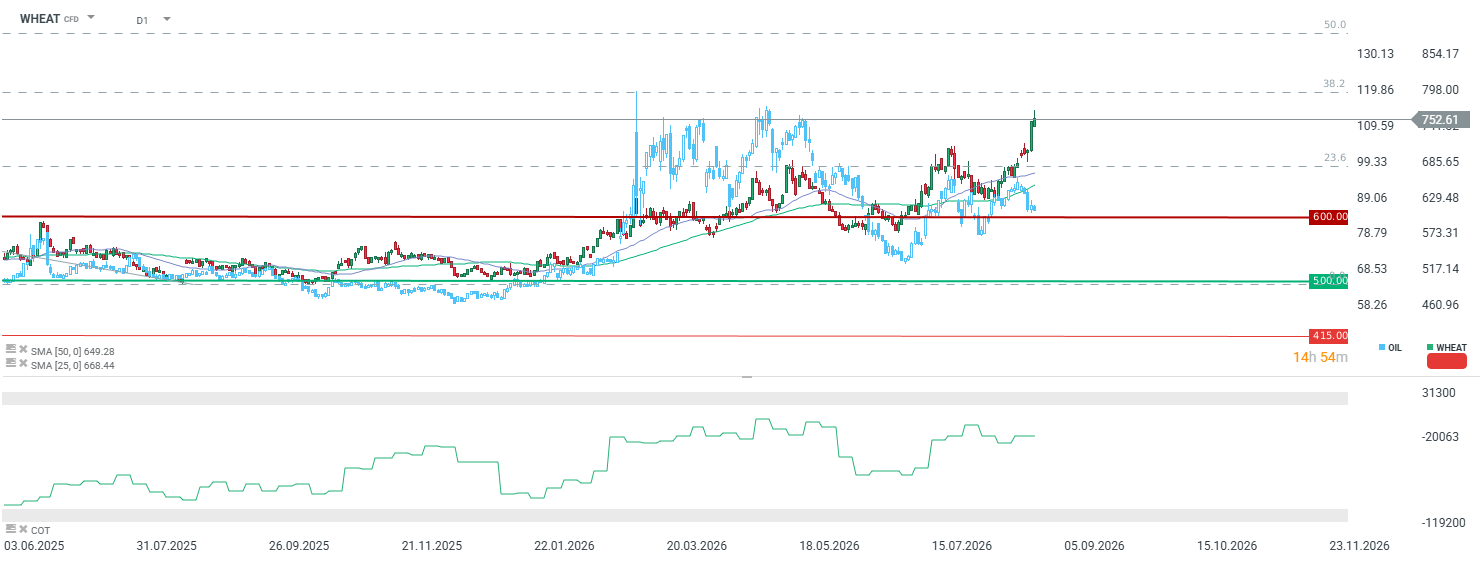 Wheat prices are experiencing powerful gains, which are linked to the possible escalation of the war in Ukraine. Additionally, one should remember the rising costs associated with fertilizers and oil prices. El Nino and dry weather in the United States also have a significant impact on prices. The overlap of these factors indicates the possibility of attempting to test at least 800 cents per bushel at the 38.2 retracement of the downtrend wave started in May 2022. On the other hand, it is worth noting that the divergence with oil currently indicates wheat overvaluation, so any de-escalation in the Middle East and Ukraine could erase the recent wheat premium and direct it to the vicinity of 680 cents, and subsequently 630 cents per bushel.



Oil falls below $100🚨


💶Chart of the Day: EURUSD at Lowest Since May 2025 Amid French Fiscal Crisis

Morning Briefing: Dollar gains, oil falls. EURUSD at multi-month lows



Morning Wrap: Tech Rally in Asia Following Micron Results and Weakening Yen Despite Hawkish BoJ
This content has been created by XTB S.A. This service is provided by XTB S.A., with its registered office in Warsaw, at Prosta 67, 00-838 Warsaw, Poland, entered in the register of entrepreneurs of the National Court Register (Krajowy Rejestr Sądowy) conducted by District Court for the Capital City of Warsaw, XII Commercial Division of the National Court Register under KRS number 0000217580, REGON number 015803782 and Tax Identification Number (NIP) 527-24-43-955, with the fully paid up share capital in the amount of PLN 5.869.181,75. XTB S.A. conducts brokerage activities on the basis of the license granted by Polish Securities and Exchange Commission on 8th November 2005 No. DDM-M-4021-57-1/2005 and is supervised by Polish Supervision Authority.