



Bitcoin is pulling back toward $78,000 today after higher-than-expected U.S. PCE data, but it still serves as something of a litmus test for the broader crypto bull market and has already delivered an impressive rebound. It is Bitcoin that deserves the most attention here, given that it has already risen by almost 40% from the local cycle low near $57,000 to around $80,000. Last week’s move caught the market off guard, with BTC jumping from roughly $63,000 and, importantly, giving back very little of that advance so far. New demand is absorbing a meaningful part of the profit-taking. The scale of the rebound is significant, but what is even more interesting is what is happening beneath the surface: spot volumes are rising, derivatives activity is increasing, ETF inflows are strengthening and the number of active addresses on the network is moving higher. This no longer looks like a purely technical rebound after an oversold move, although the short squeeze undoubtedly helped accelerate it. At the same time, the market is becoming increasingly overheated as leverage and the share of short-term capital rebuild quickly alongside the price. Bitcoin is strong again, but the closer it gets to $80,000–82,000, the more questions emerge about how sustainable the entire move really is.
- Bitcoin rose from around $63,000 to nearly $80,000 within a week and briefly traded above $81,000.
- U.S. spot Bitcoin ETFs attracted around $650 million in net inflows on Monday and Tuesday, following roughly $1.9 billion of inflows in the previous week.
- BlackRock’s IBIT accounted for the majority of fresh ETF demand, attracting around $493 million during the first two sessions of the week.
- Open interest and futures-market activity are rising again, confirming the return of speculative capital and stronger risk appetite.
- On-chain activity has accelerated noticeably: the number of active addresses, transfer volumes and the share of supply in profit are all increasing.
- According to Glassnode data, a growing part of the move is being driven by so-called hot capital, or short-term capital, while broader long-term inflows remain relatively moderate.
Bitcoin price supported by ETFs and BlackRock
The most positive element of the current rebound is the return of inflows into spot Bitcoin ETFs. On Monday, the funds attracted around $337.6 million in net inflows, followed by another $314.3 million on Tuesday, bringing the total to approximately $651.9 million since the start of the week. This is significant because the previous week was even stronger, with roughly $1.92 billion in net inflows, making it one of the best weeks for U.S. Bitcoin ETFs this year.
BlackRock remains by far the largest player. IBIT alone attracted around $208.9 million on the first day and another $284.4 million on the next, for a combined total of approximately $493.3 million. In other words, roughly three quarters of all fresh ETF demand came from a single product. That illustrates both the strength of institutional demand and the growing role of ETFs in stabilizing the market.
At this stage, ETF flows are probably one of the strongest arguments that the current move is not being driven solely by short covering. Capital is genuinely flowing into the spot market. The real question is how durable these inflows will prove to be, and whether they will continue once Bitcoin stops rising by several percentage points per day. We do not have that answer yet, but the macro backdrop and the situation in the U.S. bond market appear to be working in Bitcoin’s favor.
Short squeeze accelerated the move, while leverage is rebuilding
The derivatives market is telling a very similar story, only in a much more aggressive way. Taker flows in perpetual futures have shifted decisively toward buyers, while cumulative volume measures have moved above their upper statistical bands. At the same time, open interest has risen to elevated levels, showing that speculators are once again building larger leveraged positions.
The short squeeze was one of the main sources of fuel during the initial phase of the rebound. Positions worth several billion dollars were liquidated in a short period, with the overwhelming majority coming from shorts. The mechanism is simple: price starts to rise, some short positions are forced to close, the buying required to close those positions pushes prices even higher, and the move begins to feed on itself.
But the situation is now slightly different. The market is no longer just closing old shorts; it is also building new positions, increasingly on the long side. And this is where the risk of the opposite mechanism starts to rise: if Bitcoin stalls below $80,000–82,000, high leverage could quickly shift from being fuel for further gains into a source of a sharp correction.
On-chain conditions look strong
Blockchain data tracked by CryptoQuant and Glassnode confirm that the current rebound has a broader foundation than just the futures market. The number of active addresses is rising, while entity-adjusted transfer volume has accelerated clearly, pointing to stronger economic activity within the network itself. The share of supply held in profit is also increasing, while both unrealized and realized profitability metrics have moved higher.
- The number of daily active addresses rose over the week from around 623,000 to 663,000, approaching the upper statistical band near 666,400. This suggests a clear increase in user engagement and broader activity across the network.
- Entity-Adjusted Transfer Volume looks even stronger. It increased over seven days from around $3.4 billion to $5.8 billion, breaking above the upper statistical band of approximately $5 billion.
- Transaction fees are also increasing. Total Fee Volume rose from around $181,400 to $233,800 over the week, while remaining below the upper band near $248,400. The network is therefore significantly more active than a week ago, but it does not yet look overloaded or extremely speculative.
- This naturally changes investor behavior. Only recently, loss-taking and capitulation dominated the market; today, an increasing share of transactions is being realized at a profit. This is not yet a signal that the trend is ending, but it does show that supply is gradually returning to the market. The more investors sit on large unrealized gains, the greater the probability that some of them will begin to protect those profits.
Short-term, price-sensitive capital has moved clearly above its historical upper ranges, while broader long-term capital inflows remain much calmer. This suggests that the current move is being driven by a combination of genuine spot demand, ETFs, short covering and active speculation — a very powerful mix, but not necessarily as stable as classic long-term accumulation. For now, Bitcoin remains technically strong, with the $80,000–82,000 area the key zone to watch. Continued strong ETF inflows and further growth in spot-market activity would increase the chances of a sustained breakout. If inflows begin to weaken while open interest remains elevated, however, the market could quickly remind investors that after a move from $63,000 to $80,000, there is already a considerable amount of profit to protect.
The beginning of a crypto bull market? What CryptoQuant charts are showing
The CryptoQuant Bull-Bear Market Cycle Indicator has rebounded sharply from bear-market territory and moved close to the “Early Bull” zone. Historically, similar transitions have been associated with improving momentum and the beginning of more durable bullish phases, although full confirmation still requires positive readings to hold and Bitcoin’s price to continue moving higher.
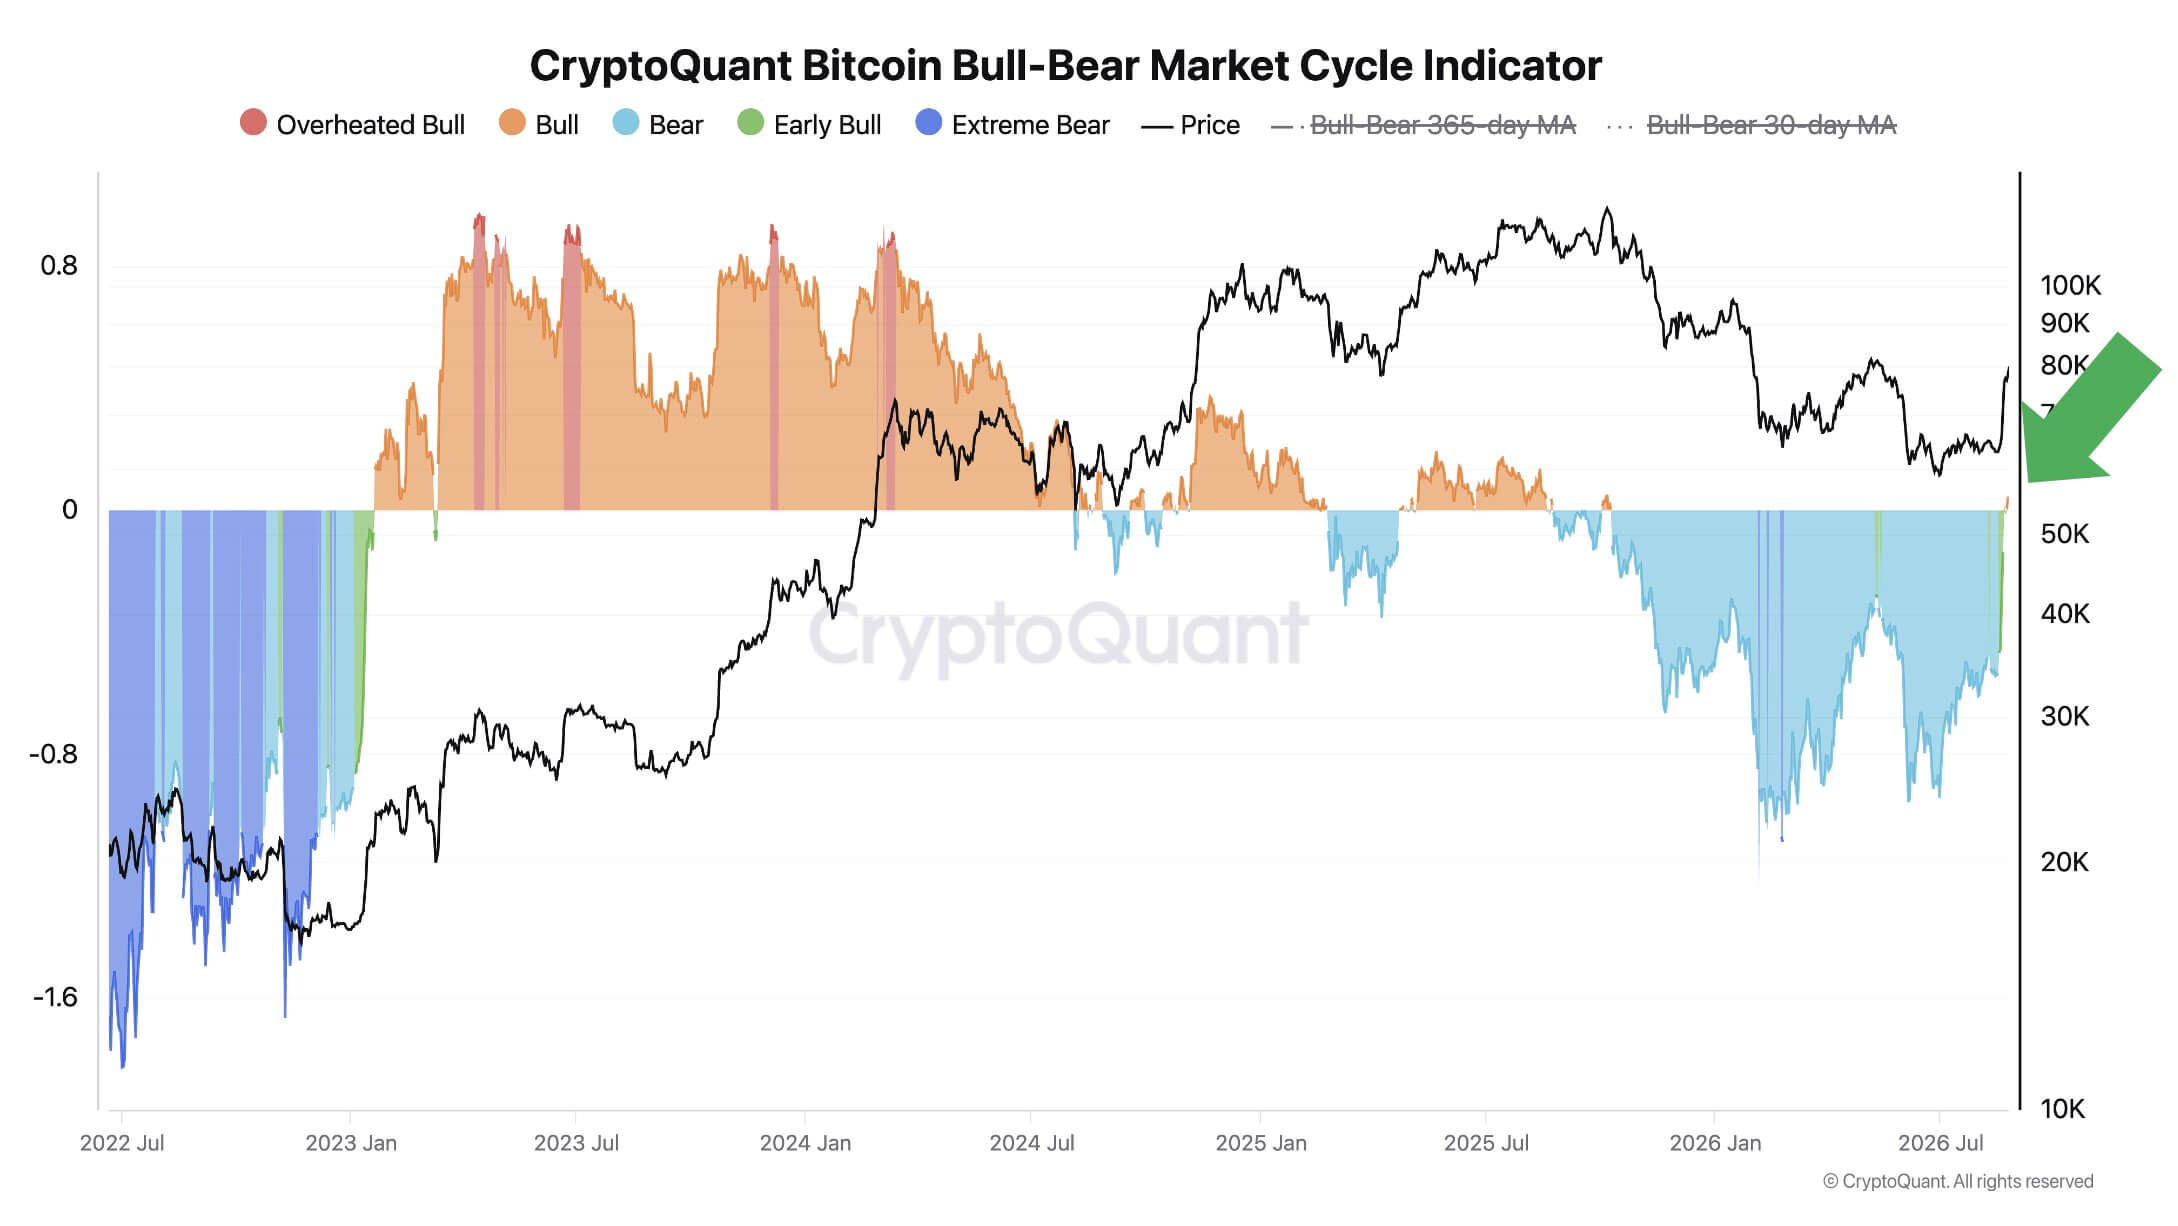
Source: CryptoQuant
Bitcoin has gained around 22% since August 17 and briefly returned to the $80,000 area. CryptoQuant’s Bull Score jumped from 30 to 80 in a single week, its highest level since October 2025. Eight of the ten monitored indicators are now flashing bullish signals, while spot demand is growing at its fastest monthly pace since late December. Importantly, spot and futures demand are increasing simultaneously for the first time since October 2025, which can theoretically be interpreted as an early stage of a new bull market. A stronger confirmation of the trend would still require a close above the 365-day moving average, currently near $83,000. In the short term, however, the market is already becoming overheated: unrealized profits have risen to 20.5%, while whales realized a record $614 million in profits on August 20.
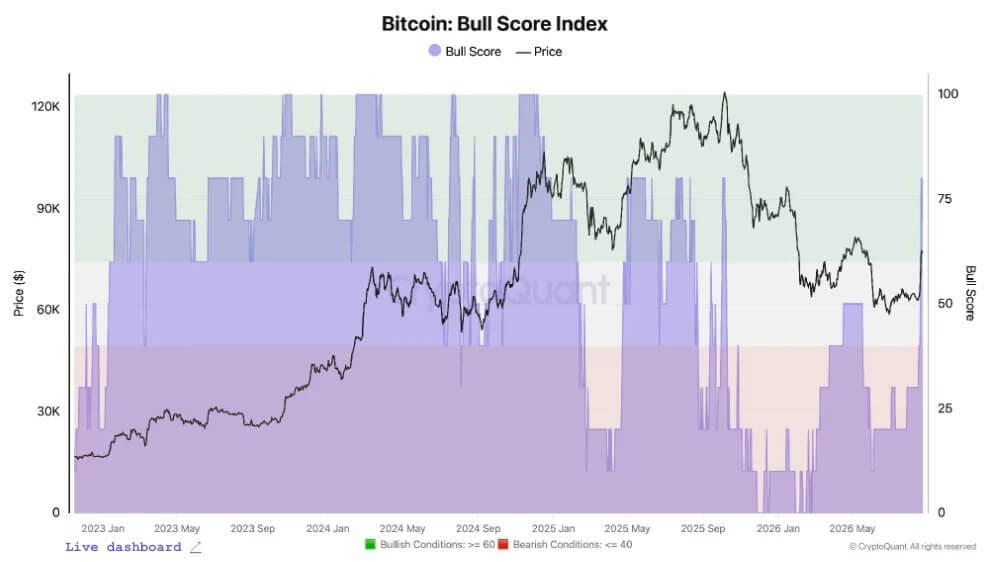
Source: CryptoQuant
Bitcoin chart (D1 interval)
Bitcoin has posted a powerful rebound, but it is still trading around 38% below its all-time high near $126,000. In that sense, the cryptocurrency technically remains within a broader bear-market structure, even after recovering above the 200-session exponential moving average, EMA200, shown by the red line. Another test of the area around $70,000 remains entirely possible, and the market’s reaction there could shape perceptions of the next phase of the recovery. Will demand return decisively? The $80,000–83,000 zone remains an important resistance area, while a sustained move above it could open the way toward $90,000. The RSI is around 80, pointing to significant overbought conditions at current levels. Any hawkish signals from Jackson Hole, where Fed Chair Warsh is due to speak on Friday, could reopen the path lower. On the other hand, continued weakness in the U.S. dollar and stress in the bond market could provide more structural support for Bitcoin, which has historically shown a negative correlation with the dollar.
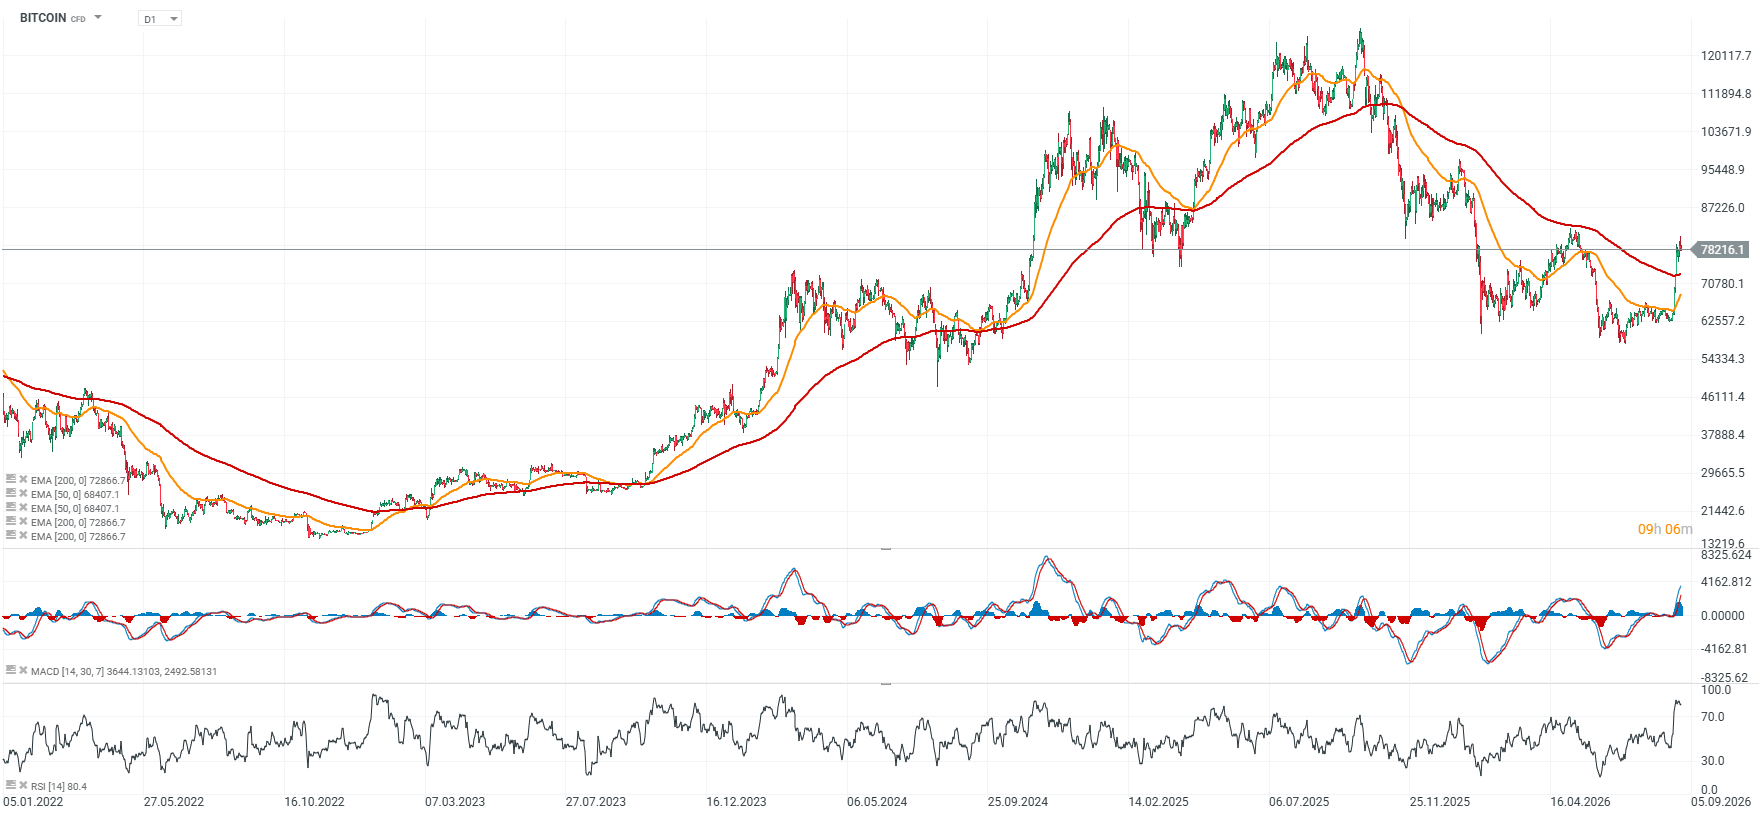 Source: xStation5


Daily Summary: New Records on Wall Street. Markets Await the New Earnings Season


US Open: Wall Street Pushes Back Expectations of Another Fed Hike



Oil falls below $100🚨

Daily Summary: Yields at their highest since 2002, yet Wall Street is still rising🚨
This content has been created by XTB S.A. This service is provided by XTB S.A., with its registered office in Warsaw, at Prosta 67, 00-838 Warsaw, Poland, entered in the register of entrepreneurs of the National Court Register (Krajowy Rejestr Sądowy) conducted by District Court for the Capital City of Warsaw, XII Commercial Division of the National Court Register under KRS number 0000217580, REGON number 015803782 and Tax Identification Number (NIP) 527-24-43-955, with the fully paid up share capital in the amount of PLN 5.869.181,75. XTB S.A. conducts brokerage activities on the basis of the license granted by Polish Securities and Exchange Commission on 8th November 2005 No. DDM-M-4021-57-1/2005 and is supervised by Polish Supervision Authority.