
This year has been marked by corrections in major stock indices, leading to new downward pressures on the EUR/USD pair (-0.83% YTD).
But, is this trend likely to persist?
Well, looking at the divergence between the U.S. dollar index and the TNOTE chart, we can see that this scenario typically supports USD strength.
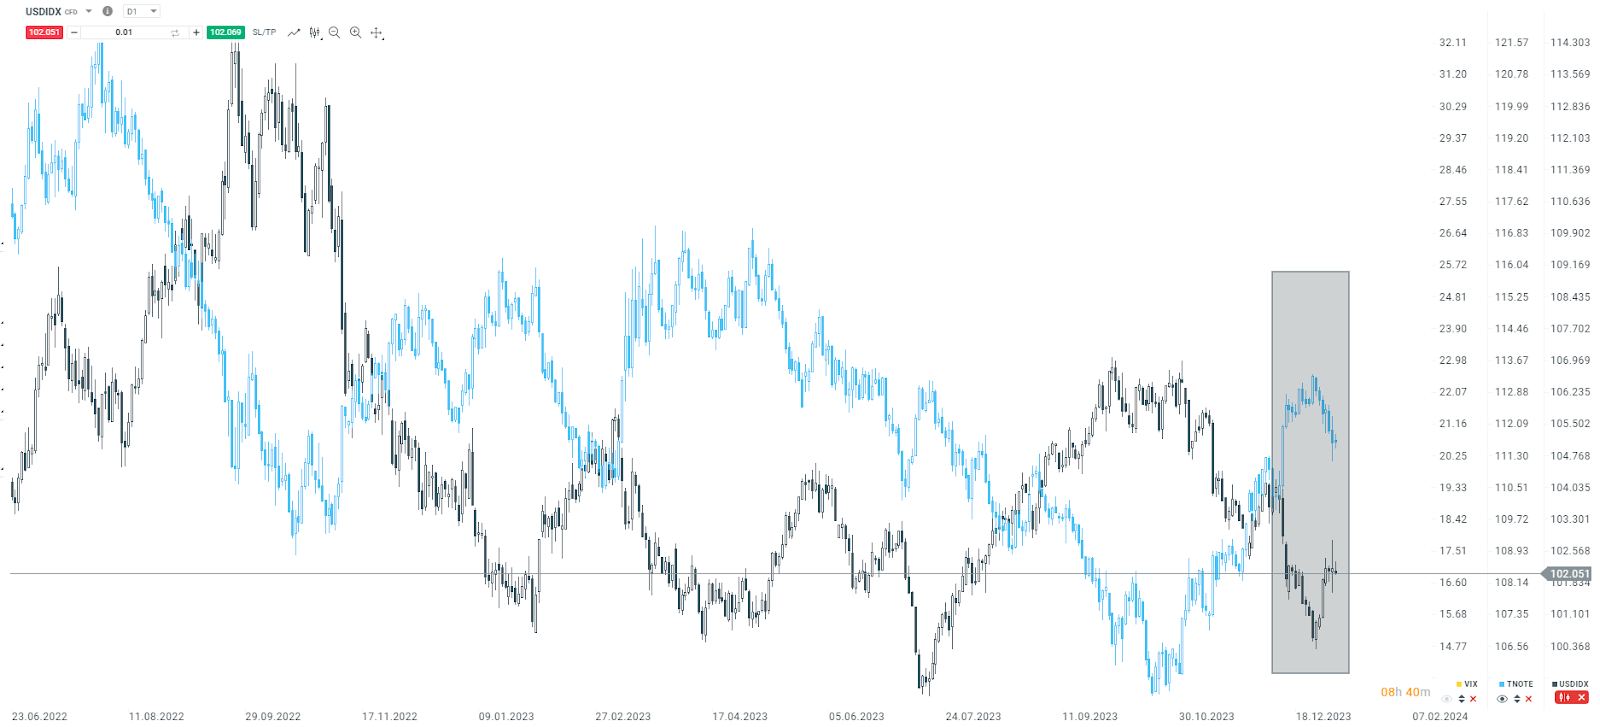
USD Index and TNOTES., Daily time frame chart. Source: xStation 5
On the other hand, the EUR/USD pair doesn't seem to show any strong technical signals that the downward trend could resume. Nevertheless, on the 4-hour chart, we observe that the resistance zone marked by the grey rectangle, along with the EMA, has played a significant role.
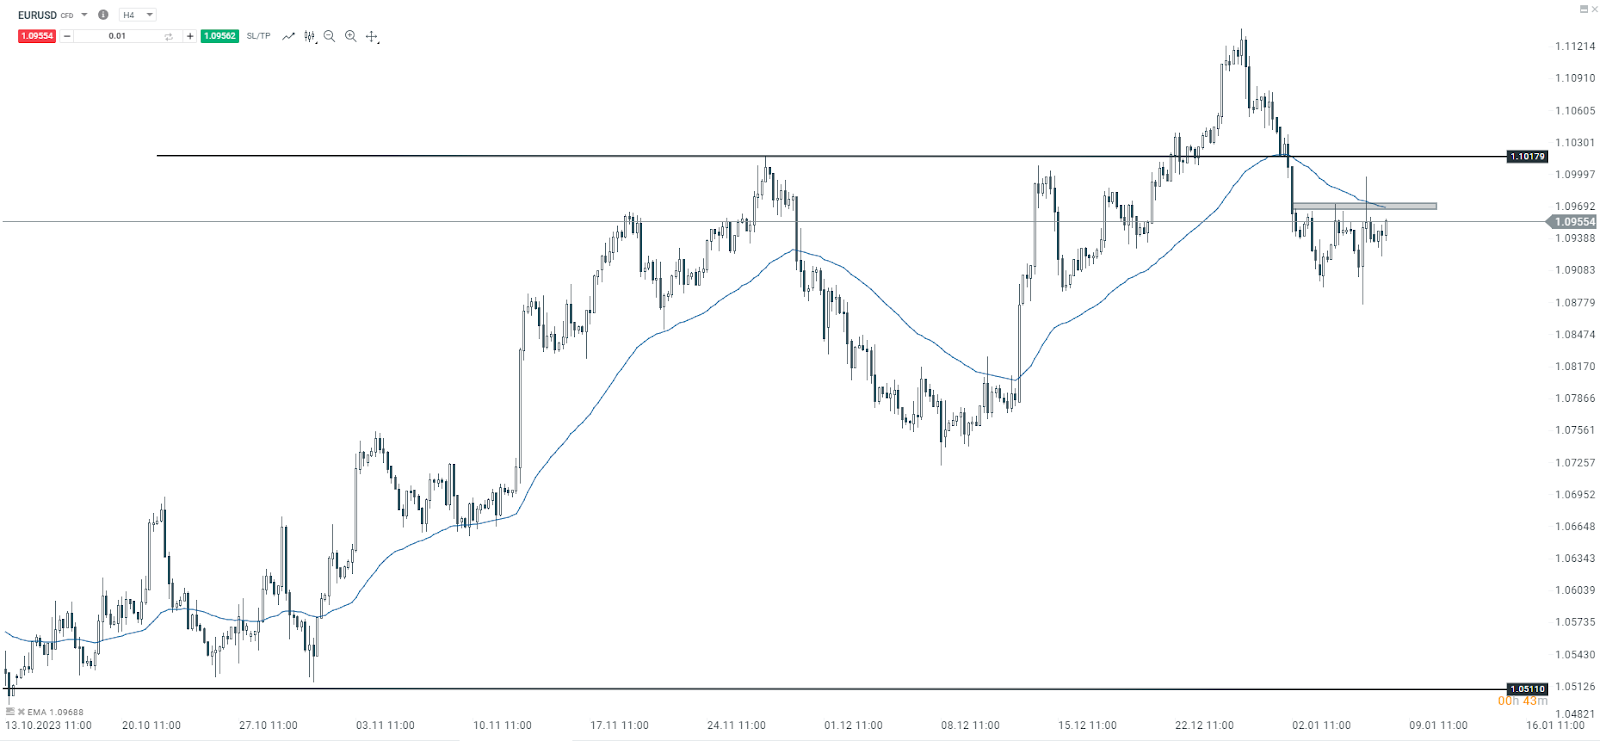
EUR/USD. 4 hours time frame chart. Source: xStation 5
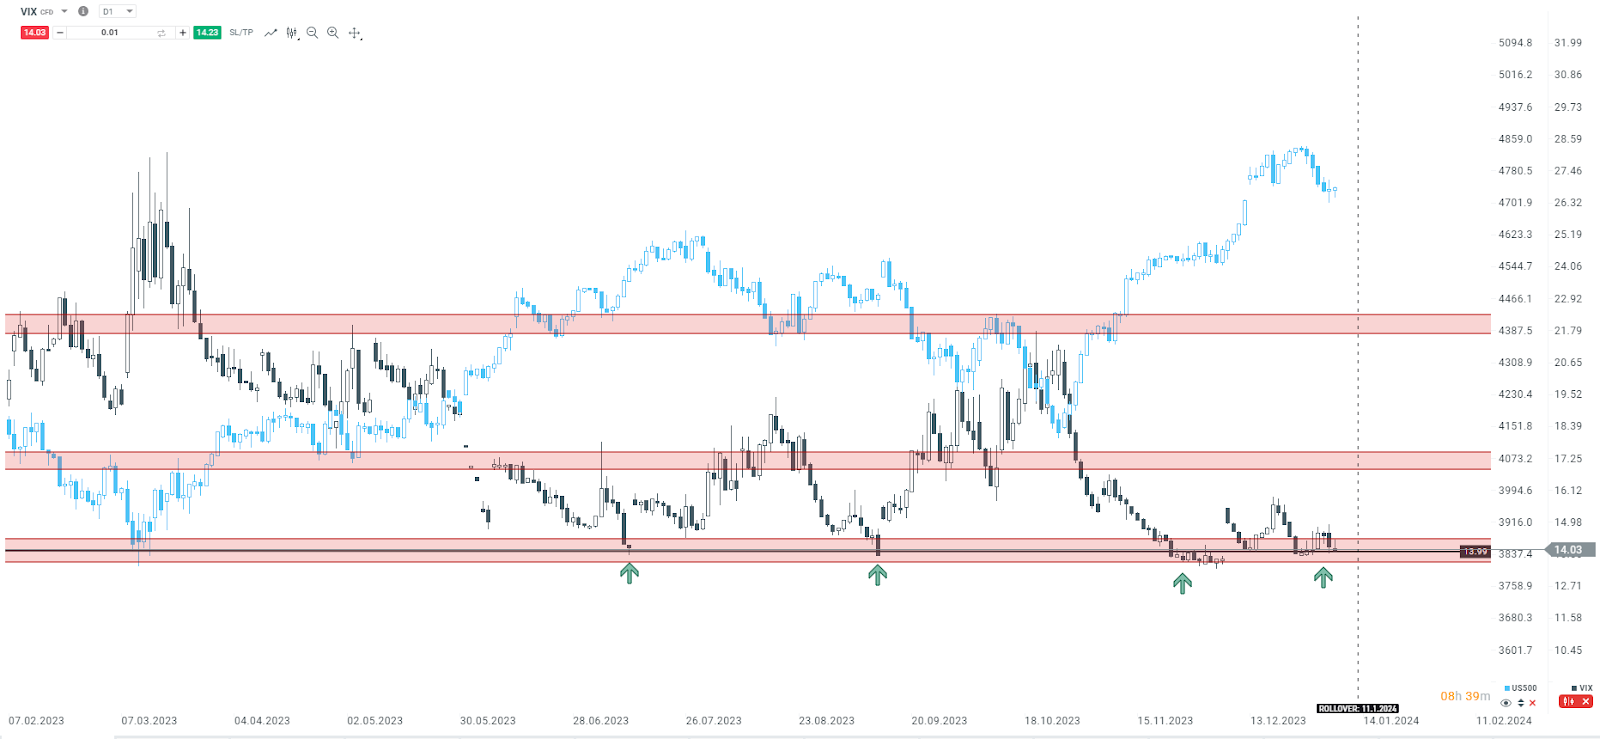
VIX and USD Index. Daily Time Frame Chart. Source: xStation 5
Henrique Tomé,
Analyst at XTB Portugal

BREAKING: US PPI Confirms Cooling Price Pressure Trend From CPI

The AI trade powers on, as luxury stocks surge

Figure of the Day: What is next for July’s strongest currency? (15.07.2026)

Economic Calendar: Wednesday brings big Q2 earnings and PPI inflation (15.07.2026)
This content has been created by XTB S.A. This service is provided by XTB S.A., with its registered office in Warsaw, at Prosta 67, 00-838 Warsaw, Poland, entered in the register of entrepreneurs of the National Court Register (Krajowy Rejestr Sądowy) conducted by District Court for the Capital City of Warsaw, XII Commercial Division of the National Court Register under KRS number 0000217580, REGON number 015803782 and Tax Identification Number (NIP) 527-24-43-955, with the fully paid up share capital in the amount of PLN 5.869.181,75. XTB S.A. conducts brokerage activities on the basis of the license granted by Polish Securities and Exchange Commission on 8th November 2005 No. DDM-M-4021-57-1/2005 and is supervised by Polish Supervision Authority.