
The start of Monday's session was marked by risk-off sentiment, however, market sentiment improved during the European session.
Daily Time Frame Chart
On the D1 chart, we can see that the price has reached an important support level(red rectangle) that coincides with the lower boundary of the channel.
This zone could provide some space for a new recovery, as long as the price stays above the structure.
This morning's sell-off reflects the importance of this structure and as long as the price remains above the lower boundary of the channel, we can expect a new bullish movement.

EUR/USD, Daily time frame chart. Source: xStation 5

USD Index. Monthly Time Frame Chart. Source: xStation 5
On the other hand, when we look at the dollar index chart, we can see that there is still room for further bull run, according to the technical target of the range that was previously broken.
Besides the dip, GBP is leading the gains at this moment.
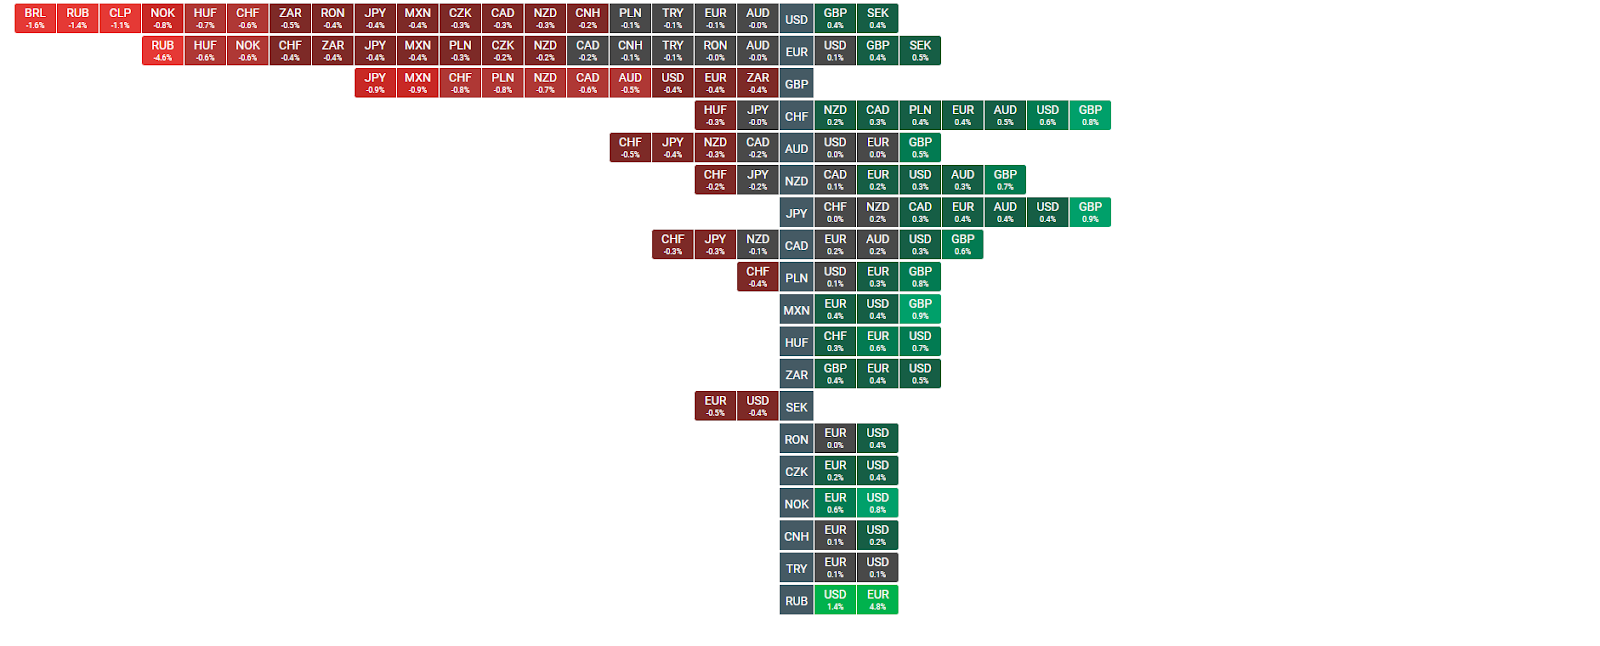
Heatmap. Source: xStation 5
Henrique Tomé, XTB Portugal

Healy makes first move as Chancellor, but bond market not impressed

Markets give a thumbs down to Burnham, as bond yields rise

Market Wrap: Airlines Under Pressure, Europe Resists Expensive Oil

Burnham takes the reigns
This content has been created by XTB S.A. This service is provided by XTB S.A., with its registered office in Warsaw, at Prosta 67, 00-838 Warsaw, Poland, entered in the register of entrepreneurs of the National Court Register (Krajowy Rejestr Sądowy) conducted by District Court for the Capital City of Warsaw, XII Commercial Division of the National Court Register under KRS number 0000217580, REGON number 015803782 and Tax Identification Number (NIP) 527-24-43-955, with the fully paid up share capital in the amount of PLN 5.869.181,75. XTB S.A. conducts brokerage activities on the basis of the license granted by Polish Securities and Exchange Commission on 8th November 2005 No. DDM-M-4021-57-1/2005 and is supervised by Polish Supervision Authority.