



The possibility of earlier-than-anticipated interest rate cuts in the Eurozone, along with the recent sell-off in indices, is exerting pressure on the EUR/USD pair.
Since sellers managed to break through the support zone defined at 1.072, the downward trend has intensified further.
However, recently there has been some indecision in the EUR/USD, with the price fluctuating within the range of 1.06 to 1.068.
On the 4-hour chart, it can be observed that the price is forming a channel pattern. If sellers succeed in breaking the lower boundary of the channel, then a new downward movement towards the next support zone at 1.055 should not be ruled out
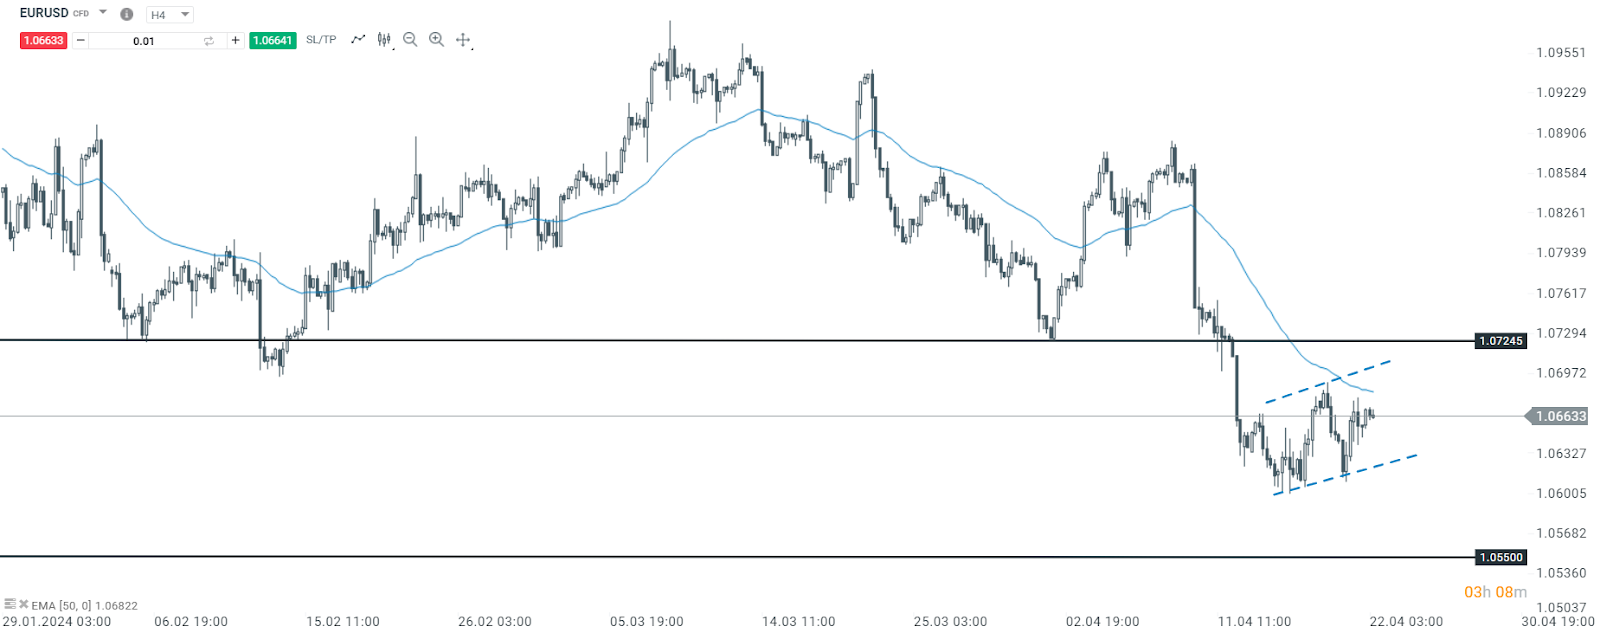
EUR/USD 4 hours time frame chart. Source: xStation 5
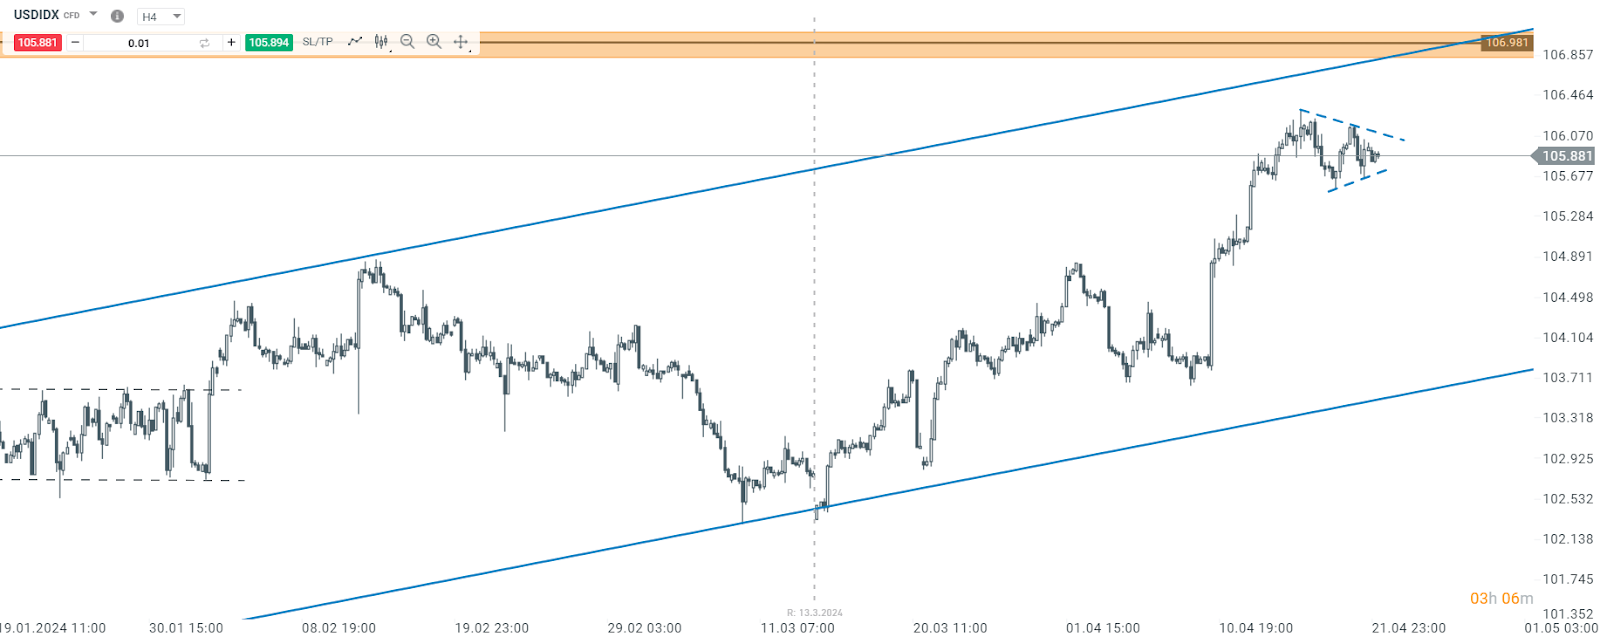
Dollar Index, 4 hours time frame chart. Source: xStation 5
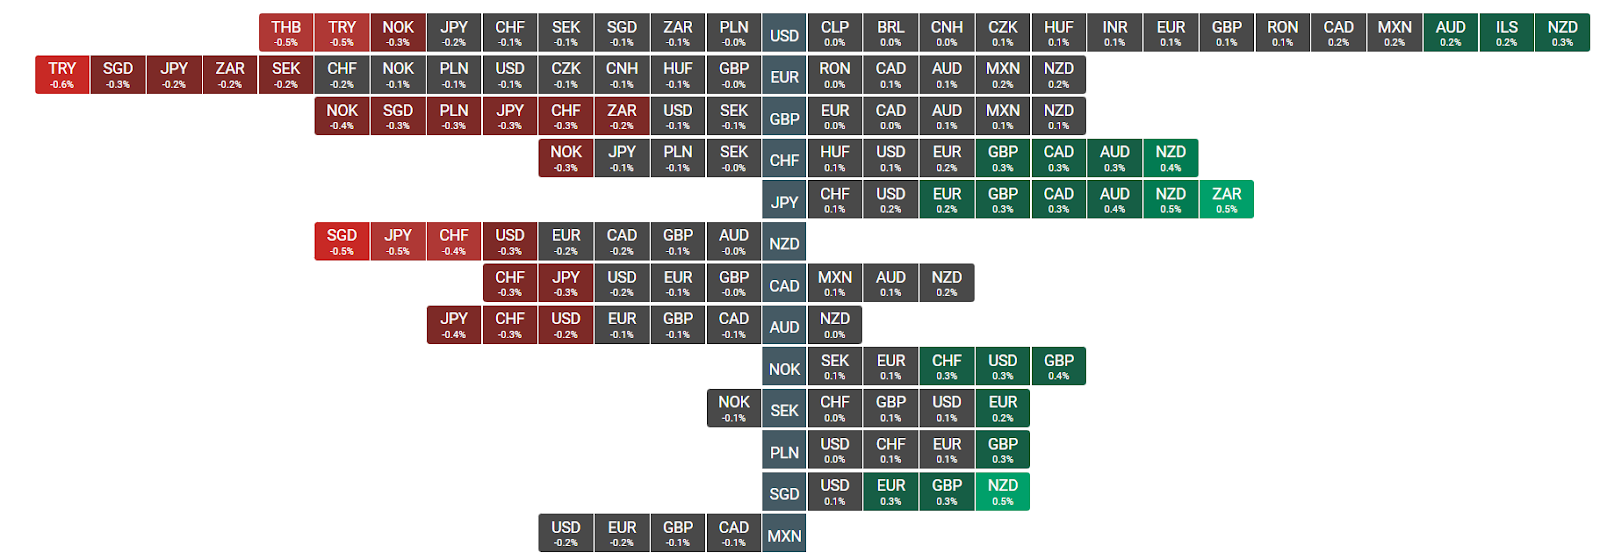
Forex Heatmap. Source: xStation 5
Henrique Tomé,Analyst Portugal


Market Wrap: Clear rebound in Europe against falling oil price. Assets related to Brazil in retreat


Chart of the day: European gas ever closer to 100 EURMWh


Economic Calendar - German Ifo index, Middle East escalation, and Wall Street giants' earnings



Elections in Brazil: Lula returns to power, markets react with panic. Brazilian ETF loses nearly 15% in Tokyo. What about USDBRL, soybeans, sugar, BRAComp, and ETFs?
This content has been created by XTB S.A. This service is provided by XTB S.A., with its registered office in Warsaw, at Prosta 67, 00-838 Warsaw, Poland, entered in the register of entrepreneurs of the National Court Register (Krajowy Rejestr Sądowy) conducted by District Court for the Capital City of Warsaw, XII Commercial Division of the National Court Register under KRS number 0000217580, REGON number 015803782 and Tax Identification Number (NIP) 527-24-43-955, with the fully paid up share capital in the amount of PLN 5.869.181,75. XTB S.A. conducts brokerage activities on the basis of the license granted by Polish Securities and Exchange Commission on 8th November 2005 No. DDM-M-4021-57-1/2005 and is supervised by Polish Supervision Authority.