
Gold has a rough time behind it. The outbreak of war in Ukraine triggered a price jump but it was of a short-term nature. Price jumped above $2,000 per ounce and traded near record highs. However, bulls were unable to maintain those gains and the price dropped to the lowest levels since mid-February - from before the beginning of Russian invasion. Rising yields as well as strengthening USD were prime reasons behind the drop. Higher interest rates encourage investors seeking safety to look for money market instruments rather than gold. However, in this analysis we will take a look at gold from a fundamental point of view. Are there any signs of the situation improving? Or maybe fundamentals also support a bearish scenario?
Significant drop in jewellery demand
Jewelry demand is a main pillar of the gold market and accounts for around 50% of total demand for gold. While the gold market is primarily driven by investment demand on market factors (i.e market rates) in the short-term, one cannot take a long-term view on gold without taking jewellery demand into consideration. Jewellery market took a 30% hit during the first quarter, mostly because of around 50% drop in demand in China as well as lower demand in India. Quarterly demand dropped below a long-term average, following a very strong previous quarter.
 Jewellery demand dropped significantly in Q1 2022 and was below a long-term average. However, overall demand for gold increased in Q1 2022, mainly due to strong investment demand. Is there a chance for it to continue? Source: Bloomberg, WGC, XTB Research
Please be aware that the presented data refers to the past performance data and as such is not a reliable indicator of future performance.
Strong investment demand
Investment demand for gold held firm in the first quarter of the year, although the situation is not so obvious when we take a look at details. Increase in demand was driven primarily by ETFs, while demand for physical gold - bars and coins - dropped. Jump in ETF demand was most likely driven by increase in short-term demand for gold in the aftermath of the outbreak of war in Eastern Europe. ETFs tend to sell a lot of gold in periods of rising interest rate therefore a key support for gold prices in such periods is strong jewellery demand and physical gold demand.
Investment demand and central bank demand continue to rebound. Will such situation persist in the coming quarters to support a bullish case for gold? Source: Bloomberg, WGC, XTB Research
Please be aware that the presented data refers to the past performance data and as such is not a reliable indicator of future performance.
Gold mining collapses
Finally, the latest quarterly report from the World Gold Council showed an interesting development - a collapse in gold mining. Such a situation should not take place at times when gold trades significantly above production costs ($1,000-1,200 per ounce on average). A collapse is linked to a new wave of pandemic restrictions in China. China lost a top spot in gold producers ranking (Australia took the top spot). However, China has already said that production returned to previous levels so a drop may have been short-lived. Situation in China also has an impact on jewellery and investment demand for gold. "Return to normal" in China should also support gold from a fundamental point of view. Nevertheless, it is hard to guess when the pandemic, and restrictions, will end in China.
 Gold demand exceeded supply in Q1 2022 and the 4-quarter moving average of the balance sum continues to narrow. Source: Bloomberg, WGC, XTB Research
Please be aware that the presented data refers to the past performance data and as such is not a reliable indicator of future performance.
Should we be afraid of high interest rates?
Higher interest rates cause banks to increase interest on deposits and boost yields on bonds. This may impact investors' decisions, especially at times of uncertainty over inflation, economic cycle or strength of the equity market. On the other hand, there are expectations on how high rates can increase. Base case scenario puts the US neutral rate in the 2.5-3.0% range, although some say that neutral rate may be closer to 5%. On the other hand, 10-year government bond yield should serve as an approximation of the neutral rate. Having said that, further declines on TNOTE market may be looming as current yield sits around 3%. Nevertheless, inflation has not been this high in 50 years and even more restrictive policy should be seen as a possibility.
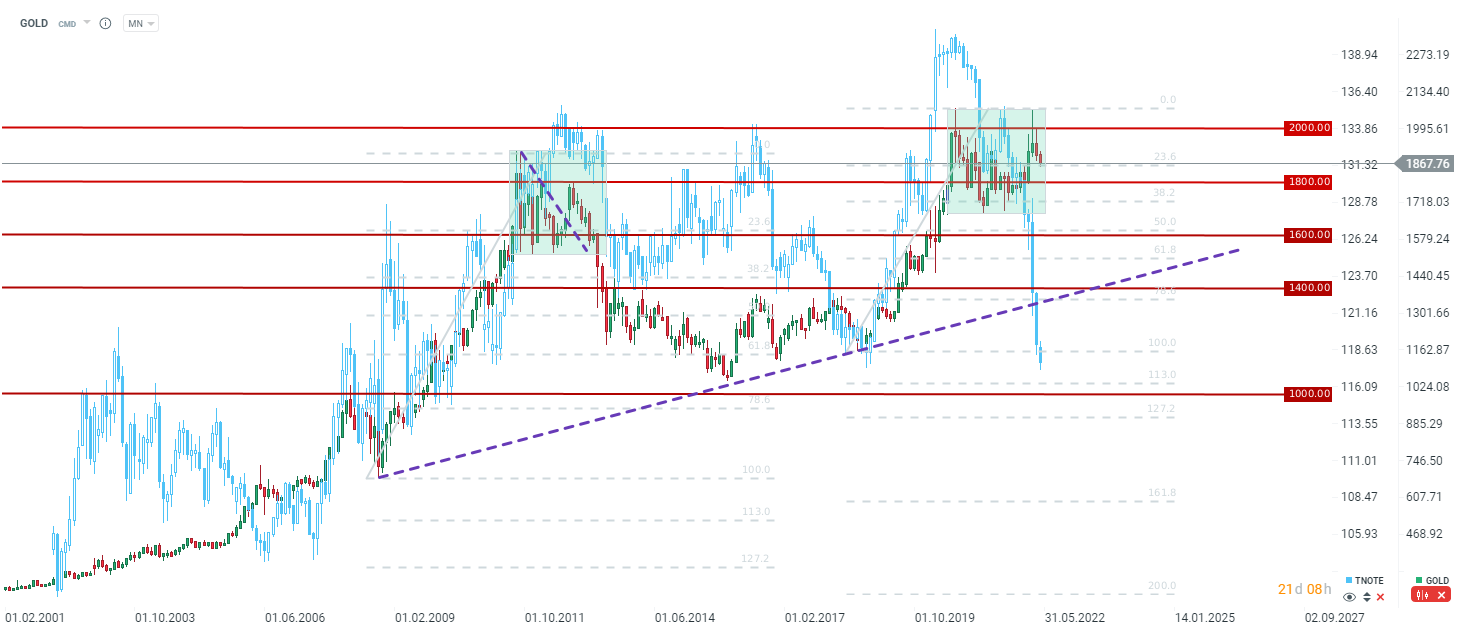 Current situation on the GOLD market starts to resemble one from 2011-2013. That's why it is crucial for bulls to defend the $1,700 support zone. However, there is still a long way to go until this level is reached. Of course, a significant drop in bond yields suggests price direction for gold but there were times in the past when the market ignored short-term spikes in yields. 2008 was such a time for example. Source: xStation5
Please be aware that the presented data refers to the past performance data and as such is not a reliable indicator of future performance.

Daily Summary: Chip War Weighs on Wall Street as Oil Plunges After US–Iran Ceasefire ⭐

🔴European TTF gas prices fall by 7.5%

Week Ahead

Morning Wrap: The weekend slump in oil prices is accelerating 💥 (27.07.2026)
This content has been created by XTB S.A. This service is provided by XTB S.A., with its registered office in Warsaw, at Prosta 67, 00-838 Warsaw, Poland, entered in the register of entrepreneurs of the National Court Register (Krajowy Rejestr Sądowy) conducted by District Court for the Capital City of Warsaw, XII Commercial Division of the National Court Register under KRS number 0000217580, REGON number 015803782 and Tax Identification Number (NIP) 527-24-43-955, with the fully paid up share capital in the amount of PLN 5.869.181,75. XTB S.A. conducts brokerage activities on the basis of the license granted by Polish Securities and Exchange Commission on 8th November 2005 No. DDM-M-4021-57-1/2005 and is supervised by Polish Supervision Authority.