


- Spot gold fell to 3 559 USD per ounce, losing over 34% from its January peak.
- Silver dropped to 42.15 USD per ounce, marking a 14% weekly decline.
- The Fed is signaling rate hikes instead of rate cuts, driving real yields higher.
- Forced liquidation from equity market losses is accelerating the sell-off in gold.

- Spot gold fell to 3 559 USD per ounce, losing over 34% from its January peak.
- Silver dropped to 42.15 USD per ounce, marking a 14% weekly decline.
- The Fed is signaling rate hikes instead of rate cuts, driving real yields higher.
- Forced liquidation from equity market losses is accelerating the sell-off in gold.
Gold is heading for its worst week since March and fell to its lowest level since September 2025. It has already lost more than 34% since its January peak. The pace of the sell-off over the past two weeks almost exactly mirrors March 2020. Back then, a sharp rebound followed a wave of forced selling. This time, however, the fuel that drove it then is missing: the Fed is not cutting rates, but signaling hikes.
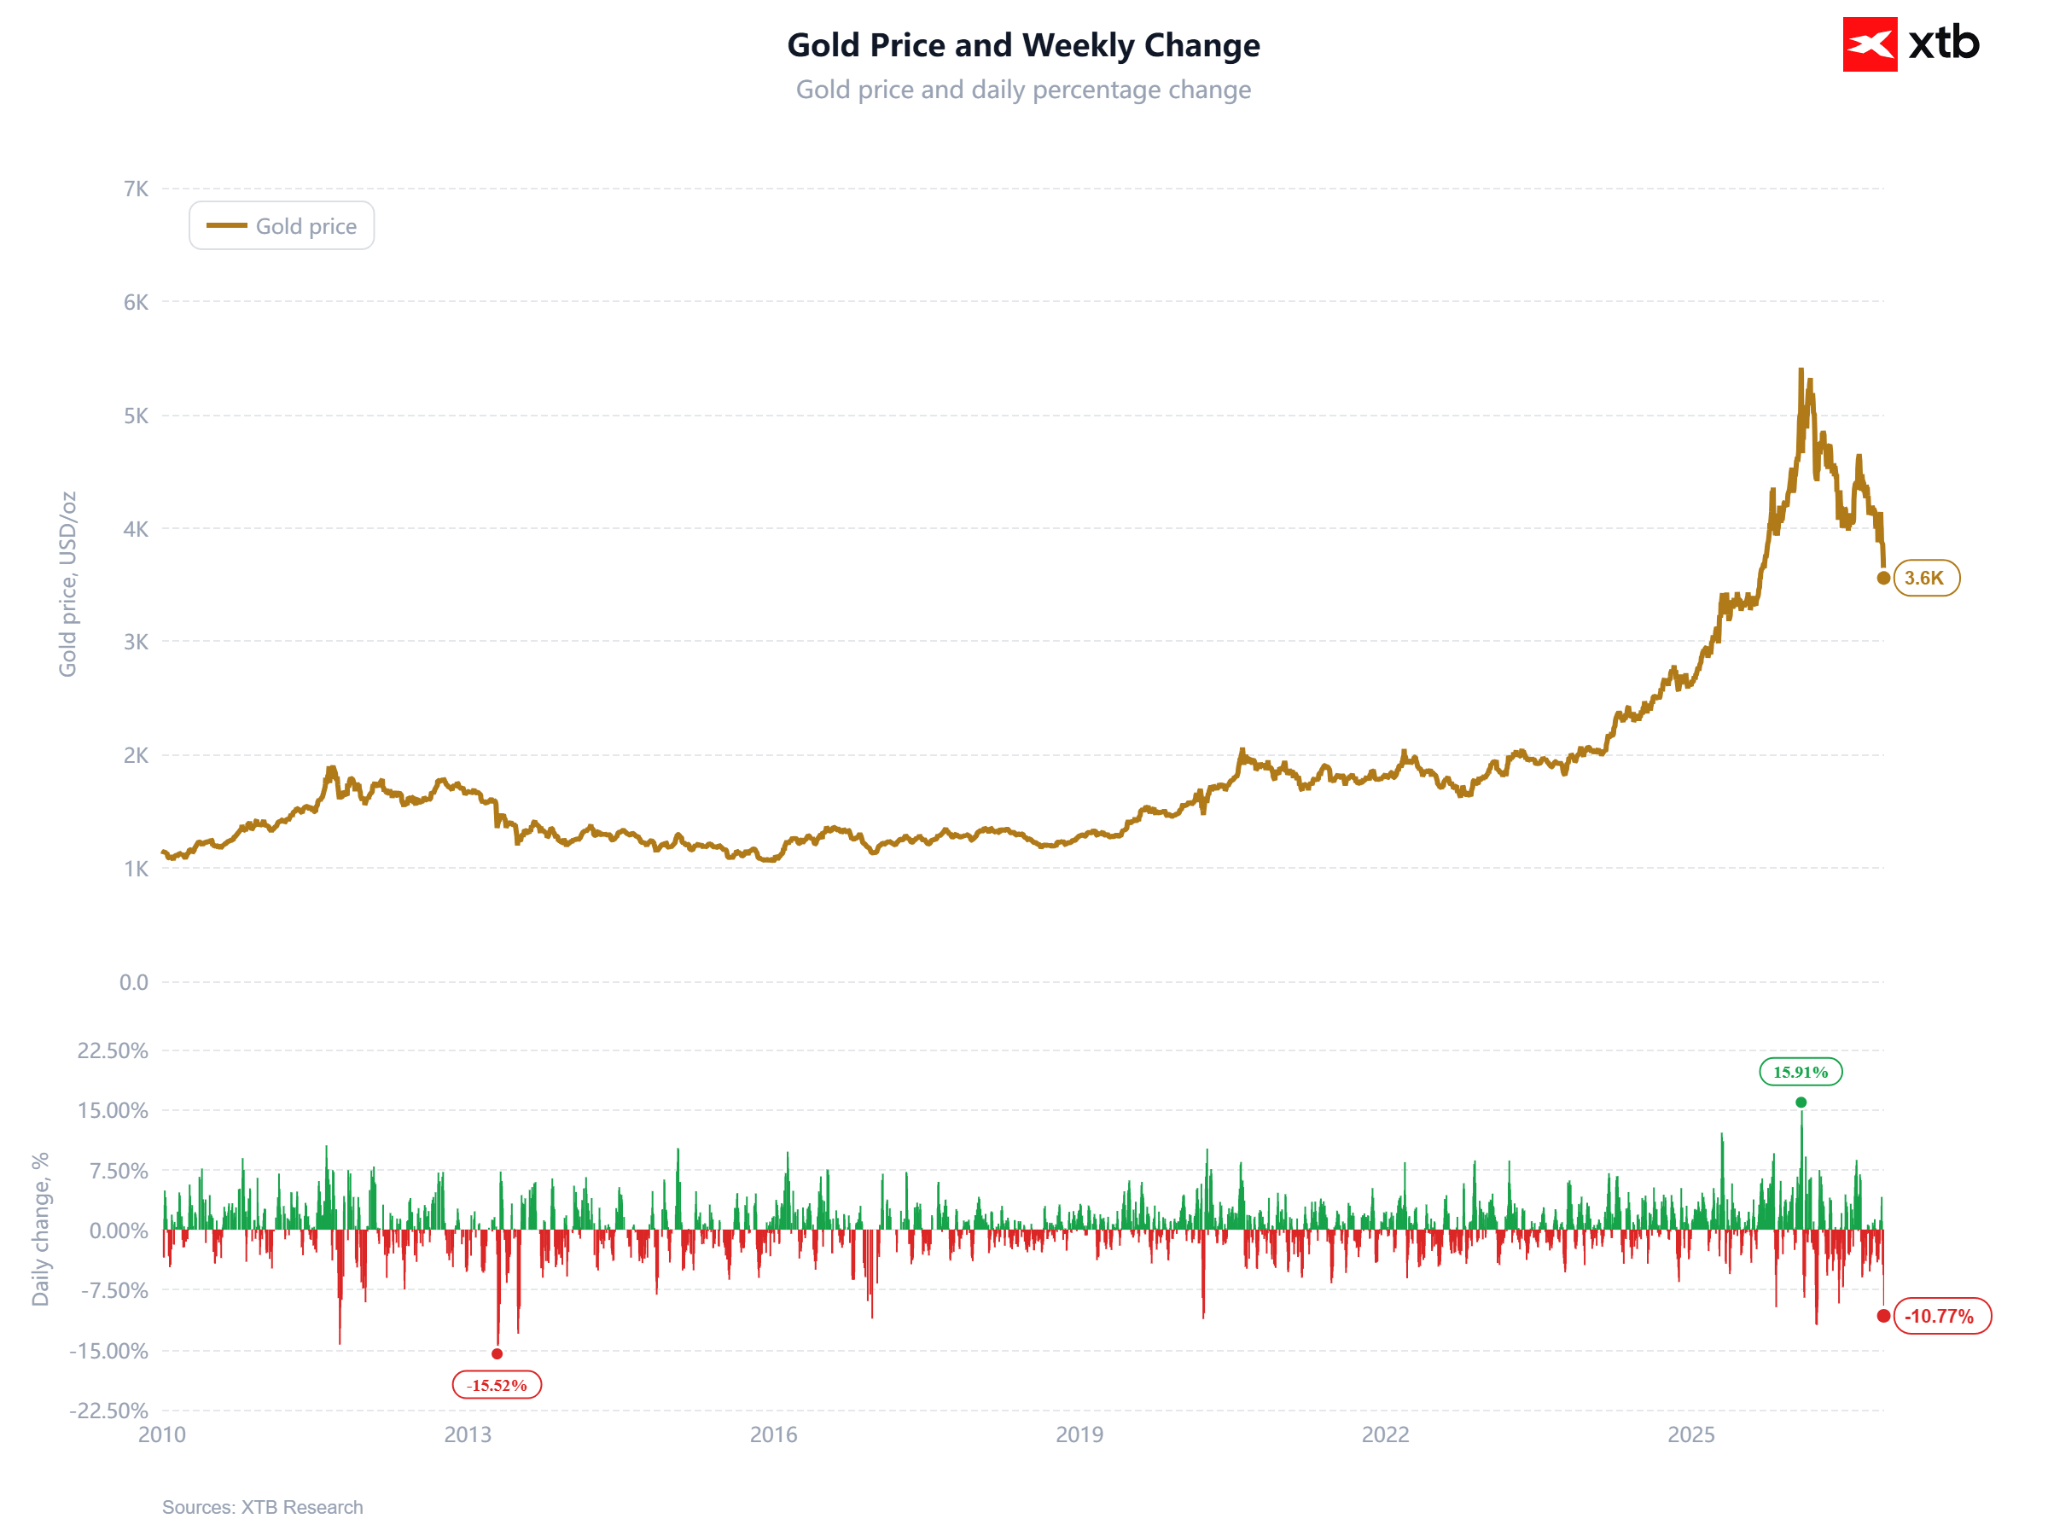
Probably the worst week for gold since March is coming to an end. Source: XTB
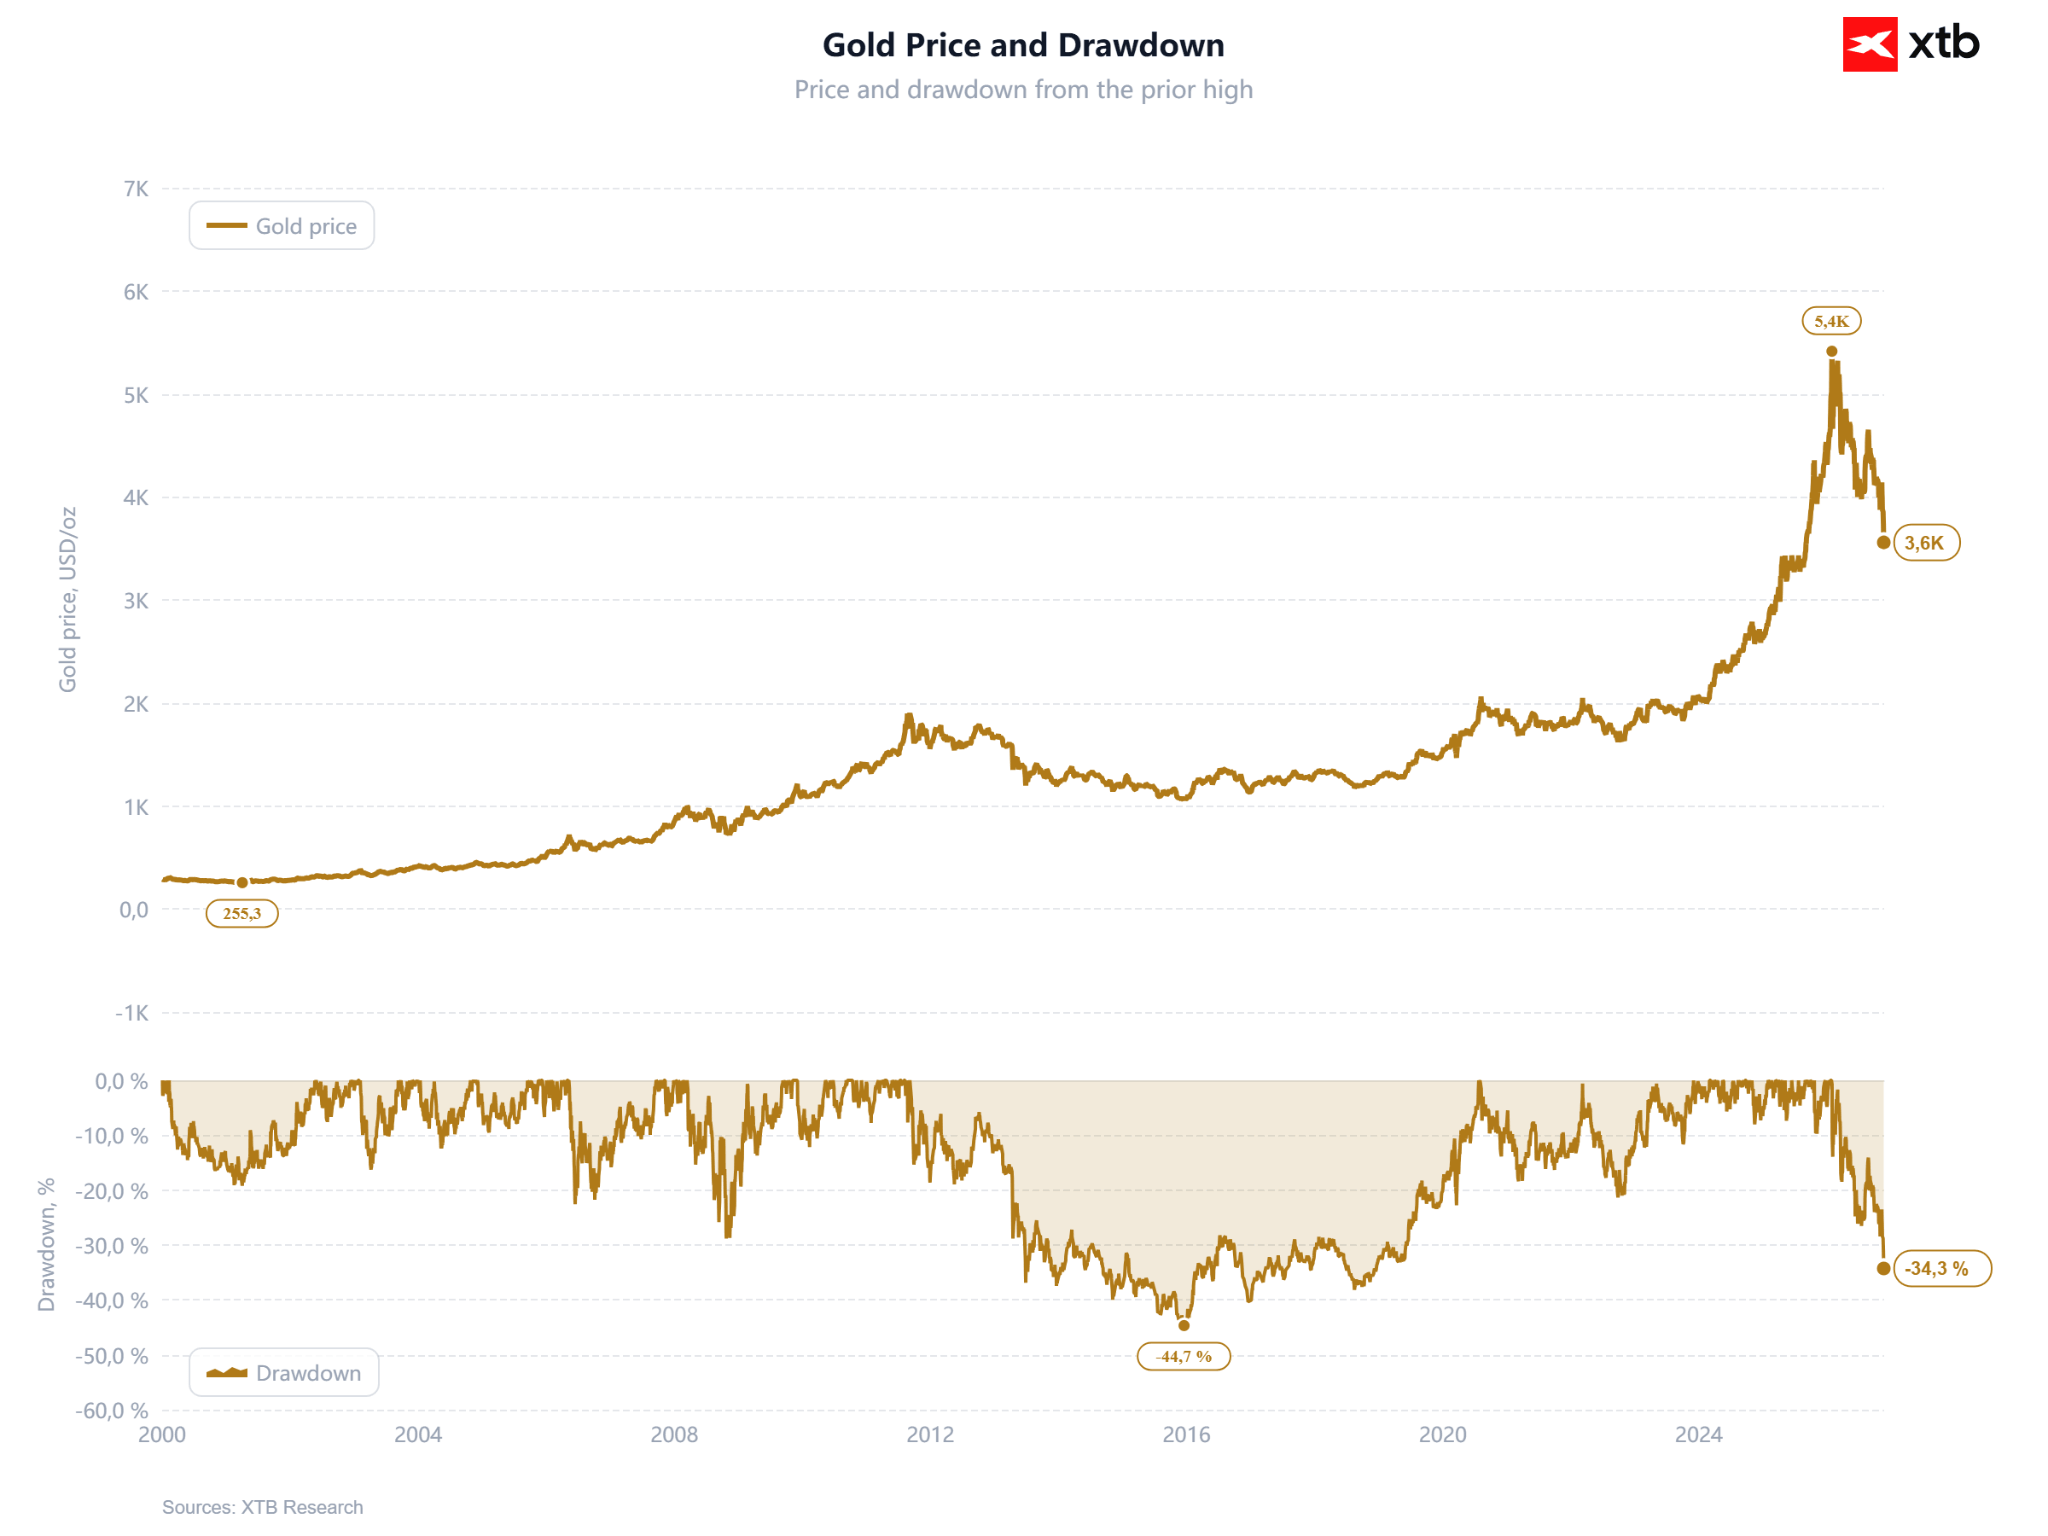 Declines from the peak already reach over 34%. The scale of the drop is unprecedented. Source: XTB
Key data:
- Spot gold: $3,559/oz (Nov 20, morning), representing a sell-off of around 2%, but during the Asian session we had a drop of over 3% and a level below $3,515.
- From the record $5,400 (Jan 28, 2026): -34%. From the outbreak of the US–Iran war (Feb 27: $5,278): -33%.
- Silver: $42.15/oz, down approx. 14% this week, down 64% from the January peak ($116.6).
- The market is pricing in a 97% probability of a 25 bps Fed rate hike in December (CME FedWatch) and a 3% probability of a 50 bps hike
- US 10-year Treasury yield: 5.008%, 28 closes above 5% this year. 10-year TIPS real yield: 2.86%, compared to 1.89% on the day of gold's record high.
- Dollar Index DXY: 103.8, highest in 19 months, fourth consecutive week of gains.
Nasdaq 100: -15% from Oct 6 peak. MSCI World: -9% from August peak. Asian equities heading for worst week since 2020.
Is it liquidity? Partially, yes
This week, gold is falling along with equities rather than in opposition to them. Since September 30, gold has lost 13%, matching the Nasdaq 100, while silver is down 29%. The broad market sell-off was triggered by artificial intelligence. Anthropic's stock market debut failed to restore confidence in the sector, Nvidia's earnings did not halt the declines, and Taiwanese equities are having their worst week since 1991. Goldman Sachs points out "weak liquidity amplifying price moves." It is evident that we are dealing with forced liquidation. Gold is fulfilling its role as a secure source of capital to cover losses resulting, for instance, from stock market declines. Investors sell what they hold at a profit and what can be quickly liquidated to cover losses and margin calls on equities. After a two-year bull market, gold was that asset.
It is worth emphasizing that this is not a one-off episode. This year, gold has been behaving like a risk asset. The 60-session rolling correlation of daily returns between gold and MSCI World currently stands at 0.46, and averaged 0.48 in 2026. Between 2019 and 2024, the average was 0.14. Gold has become a crowded position, held by the same investors who own tech stocks. When equities fall, gold often falls alongside them.
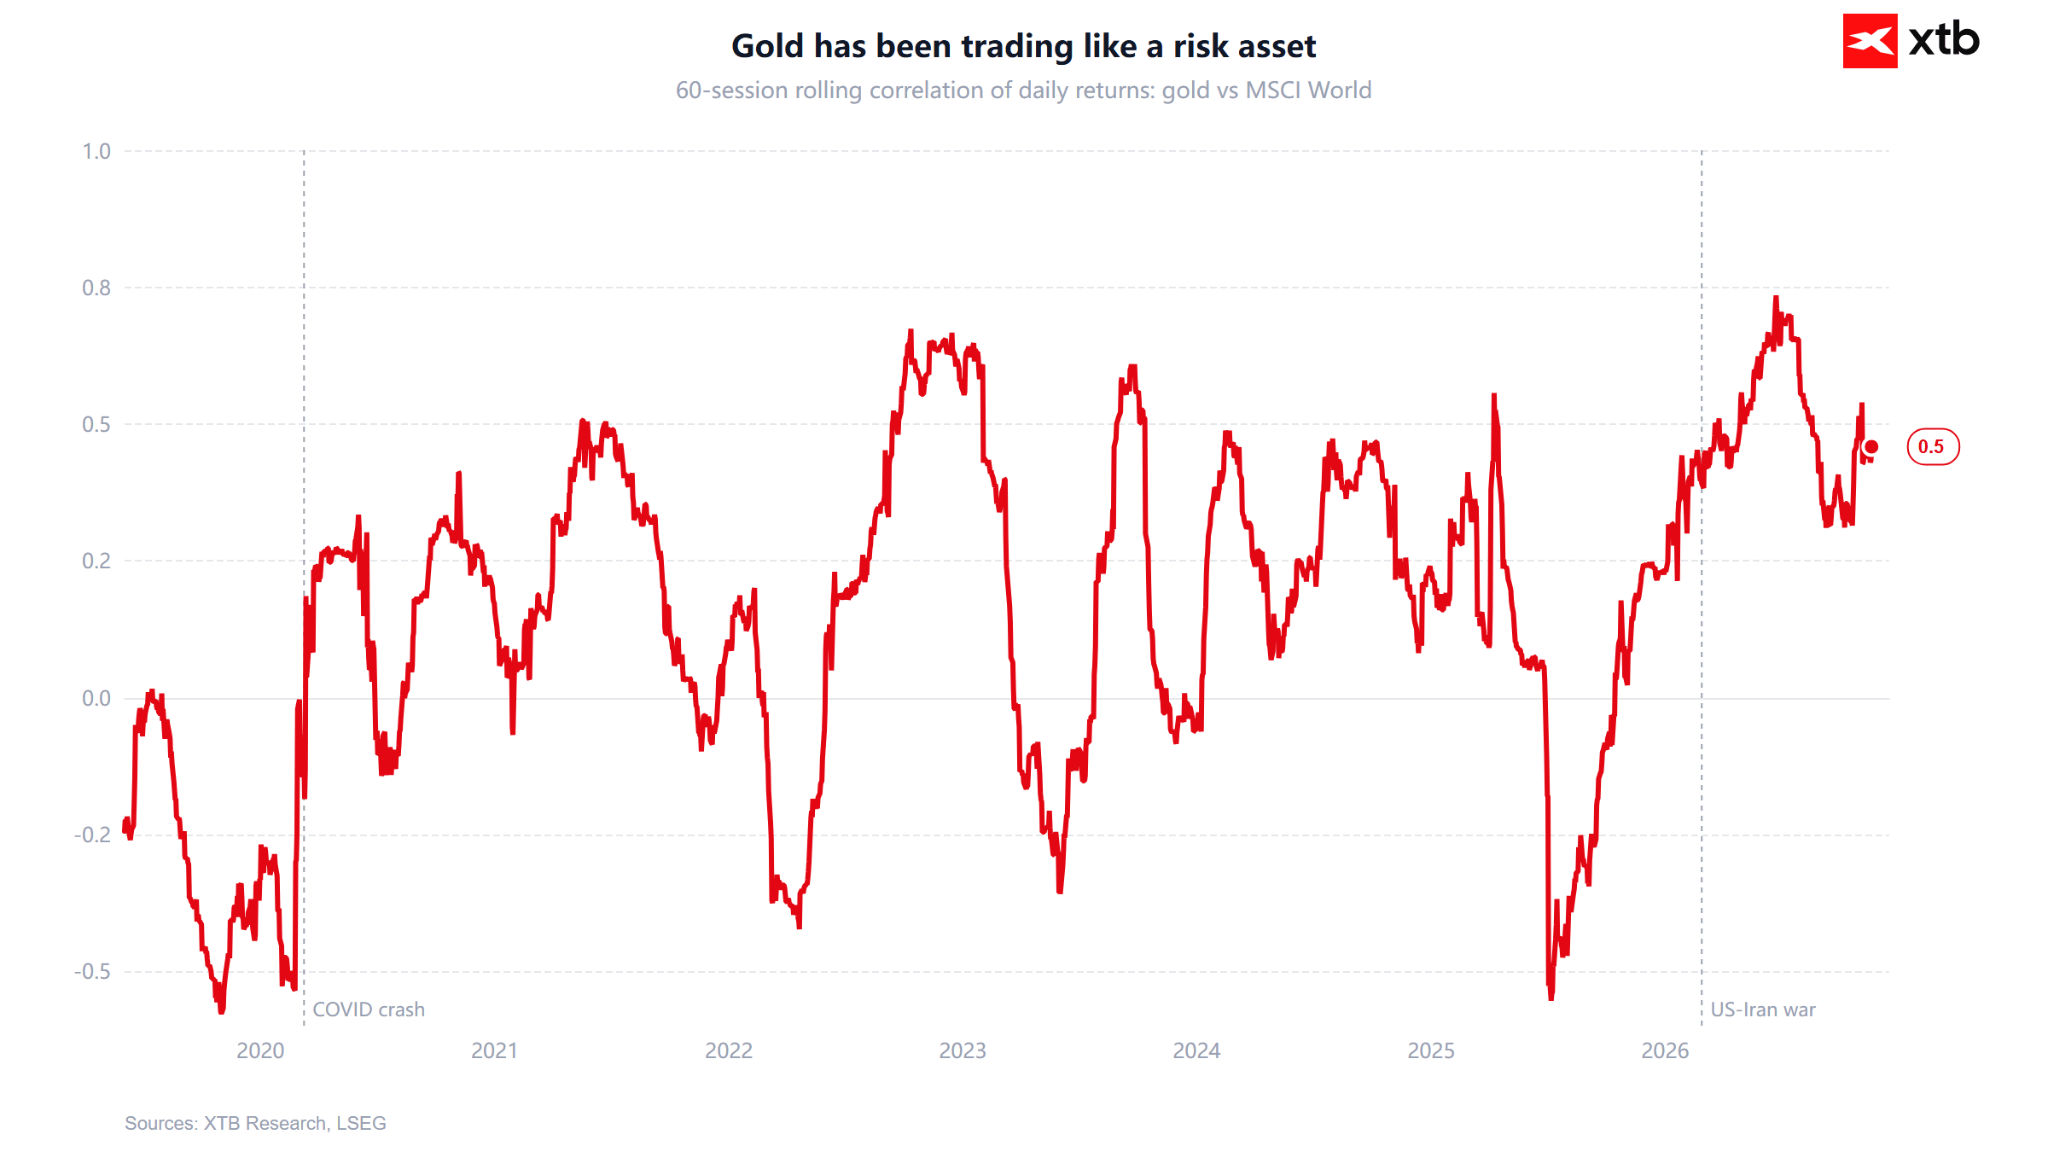
Liquidity, however, mainly explains the pace of the drop, not its direction. Gold has been depreciating since February, when equities were still rising. The primary drivers are interest rates and the US dollar. The war with Iran drove energy prices higher (Brent around $120 in March and April) and pushed inflation up, while the Fed shifted from rate cuts to signaling hikes. This week, Goolsbee and Paulson signaled that rates will need to rise again. Gold pays no yield, so with real yields close to 3%, the opportunity cost of holding it is at its highest in years.
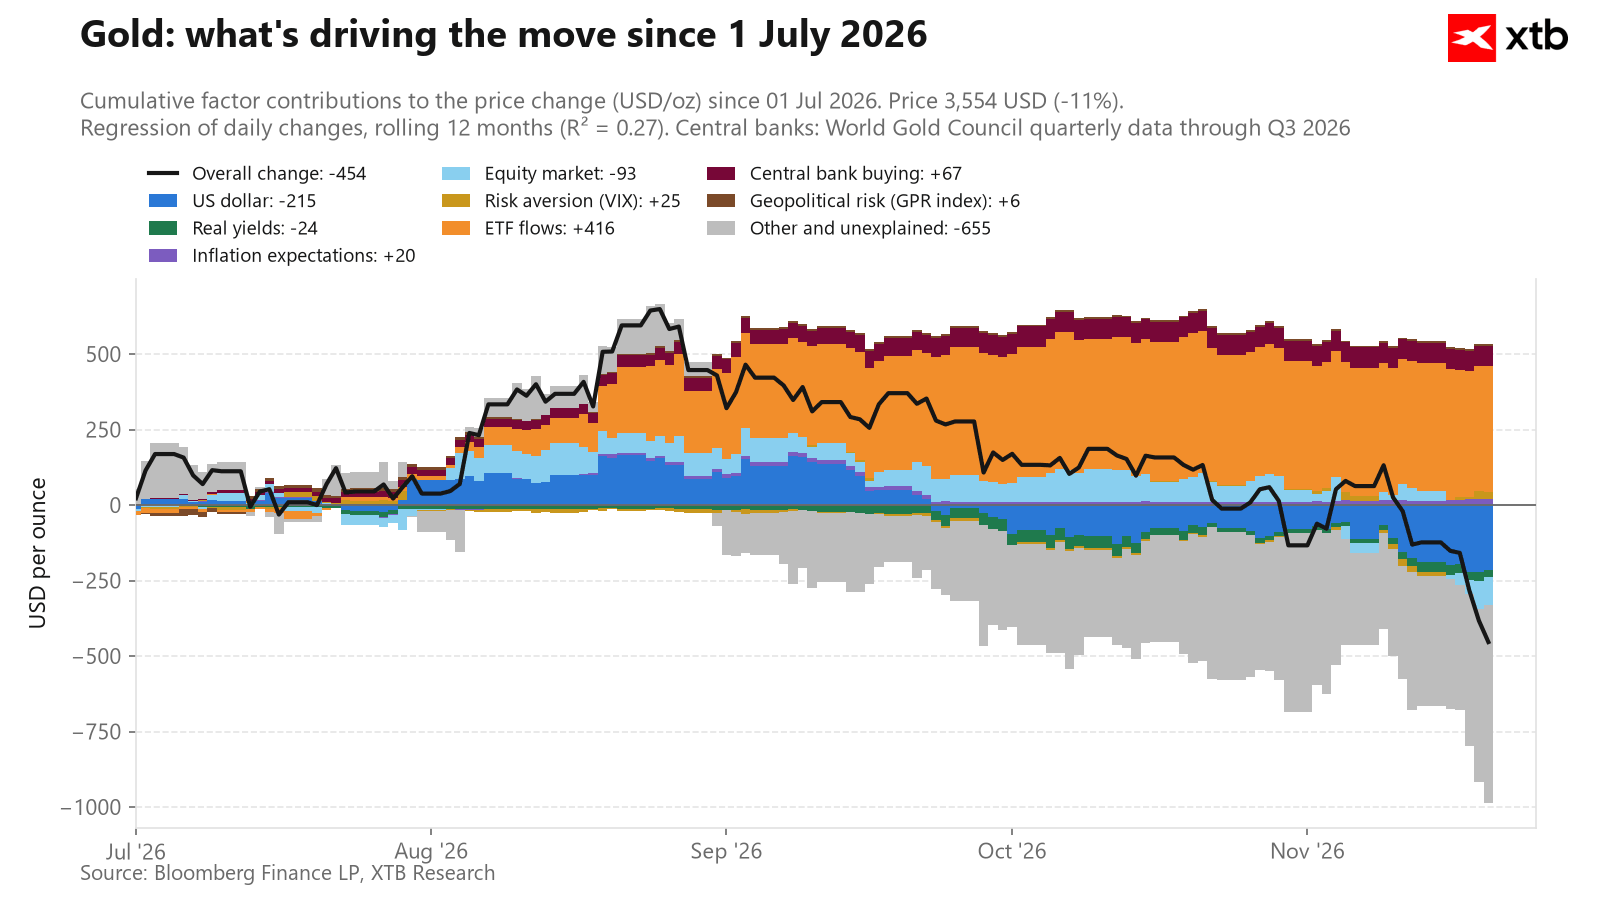 Most of the price movements earlier in the year could not be explained by any single factor. It was therefore pure speculation or the influence of geopolitical concerns. Currently, we also cannot explain a large portion of gold's price declines, which may be tied precisely to liquidity factors. Source: Bloomberg Finance LP, XTB
Are we heading for a repeat of 2020?
In terms of price trajectory, the similarity is striking. On March 9, 2020, gold reached a local peak ($1,680), and over the following 8 sessions, it lost 12.45%. Investors sold everything during the COVID crash. In 2026, from the local peak on November 9 ($4,140), gold lost 12.5% in 8 sessions—practically identical. Today, in the 9th session, the drop reaches around 14%.
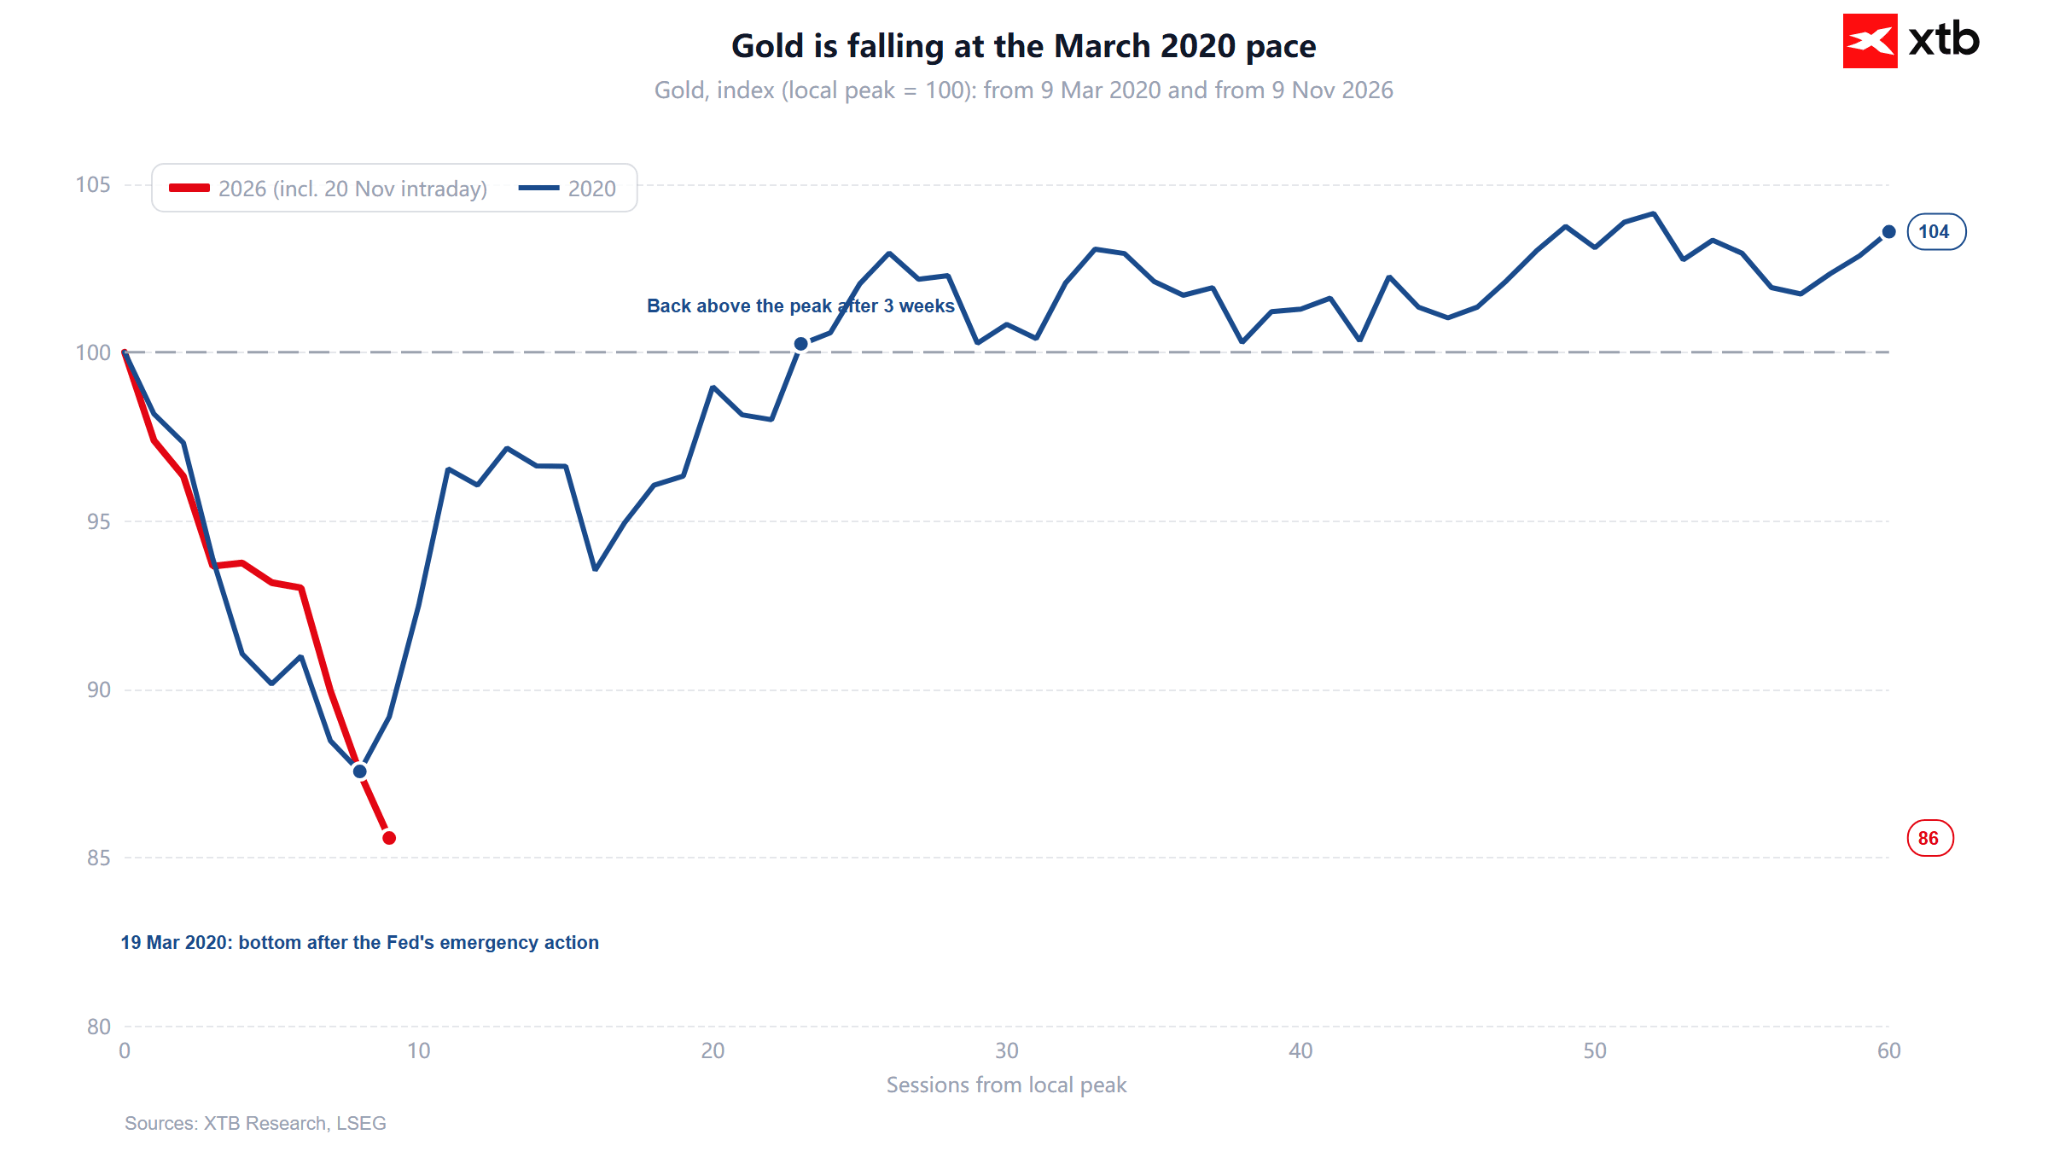
In 2020, the bottom occurred on March 19, and by April 9 gold was already back above its pre-selloff peak. In August, it set a new record of $2,064, about 40% above the March low. However, the rebound was not caused by supply exhaustion alone. The Fed slashed interest rates to zero, launched unlimited QE and swap lines, and the dollar began to weaken. The 10-year TIPS real yield fell from +0.64% on the day of the bottom to -1.09% in August.
Today, the real yield stands at 2.86%, near this year's maximum (2.95% on Oct 5). Instead of rescuing liquidity, the Fed is signaling rate hikes, and the US dollar is at its strongest level in 19 months. Thus, while the price trajectory looks similar, macro conditions are completely opposite.
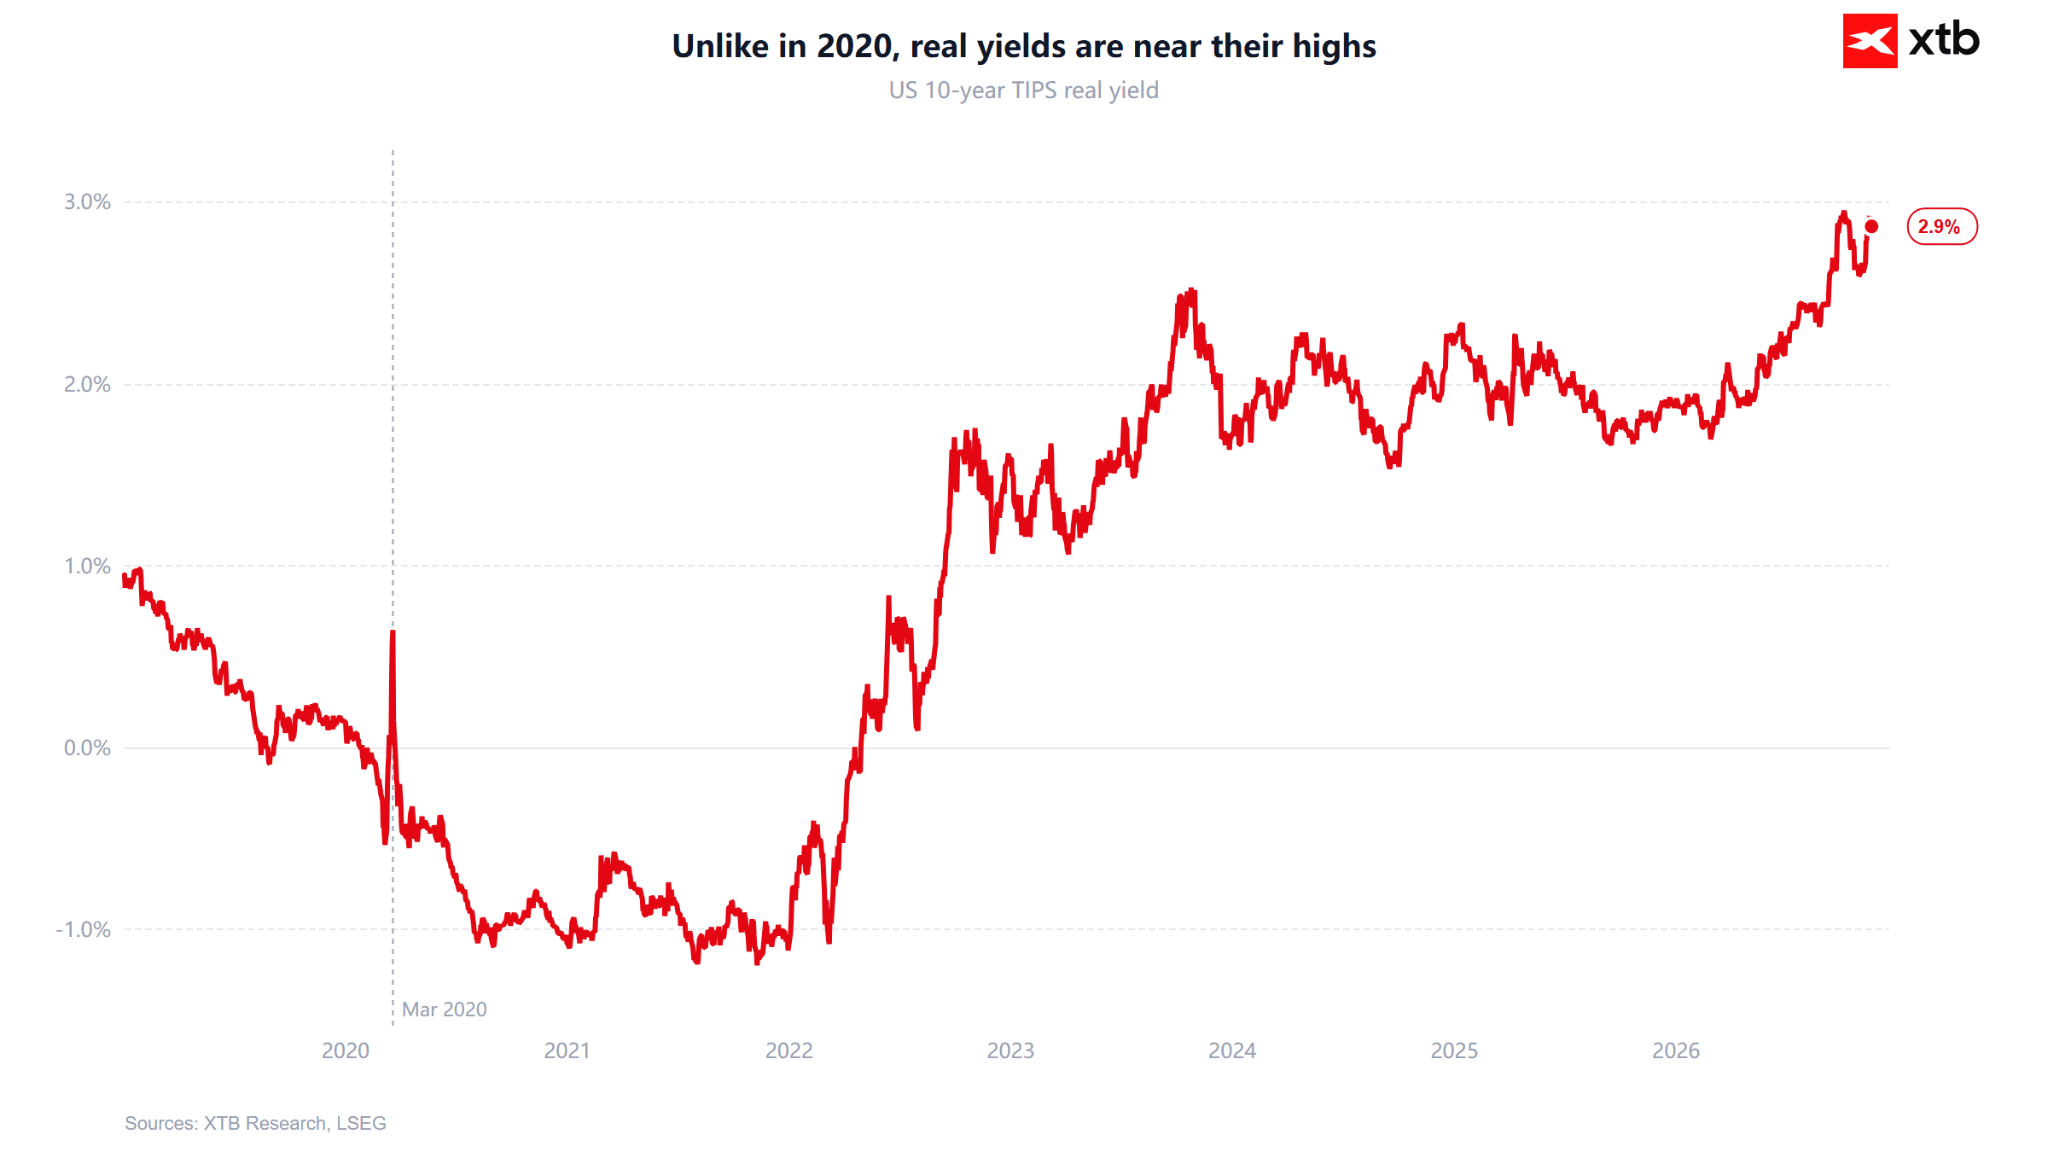
A "2020" scenario would require a pivot in Fed policy. This could occur if the AI stock sell-off turned into a credit problem, for instance due to debt in the data center sector. In that case, the Fed would have to prioritize financial stability over fighting inflation. As long as energy prices keep inflation elevated, such a pivot is harder than in 2020. Without it, a deceleration of declines is more likely than a swift V-shaped recovery.
Does the Trump–Xi–Putin summit reduce geopolitical risk?
This event has a marginal impact on markets and is not the cause of the sell-off. The Shenzhen Declaration addresses UN reform, nuclear risk, diplomatic immunity, and fuel supply. It makes no mention of Ukraine or Iran. According to Breakingviews, the summit "failed to make a significant impression on markets." Furthermore, Putin ruled out a maritime and energy truce following the attack on the Crimean Bridge.
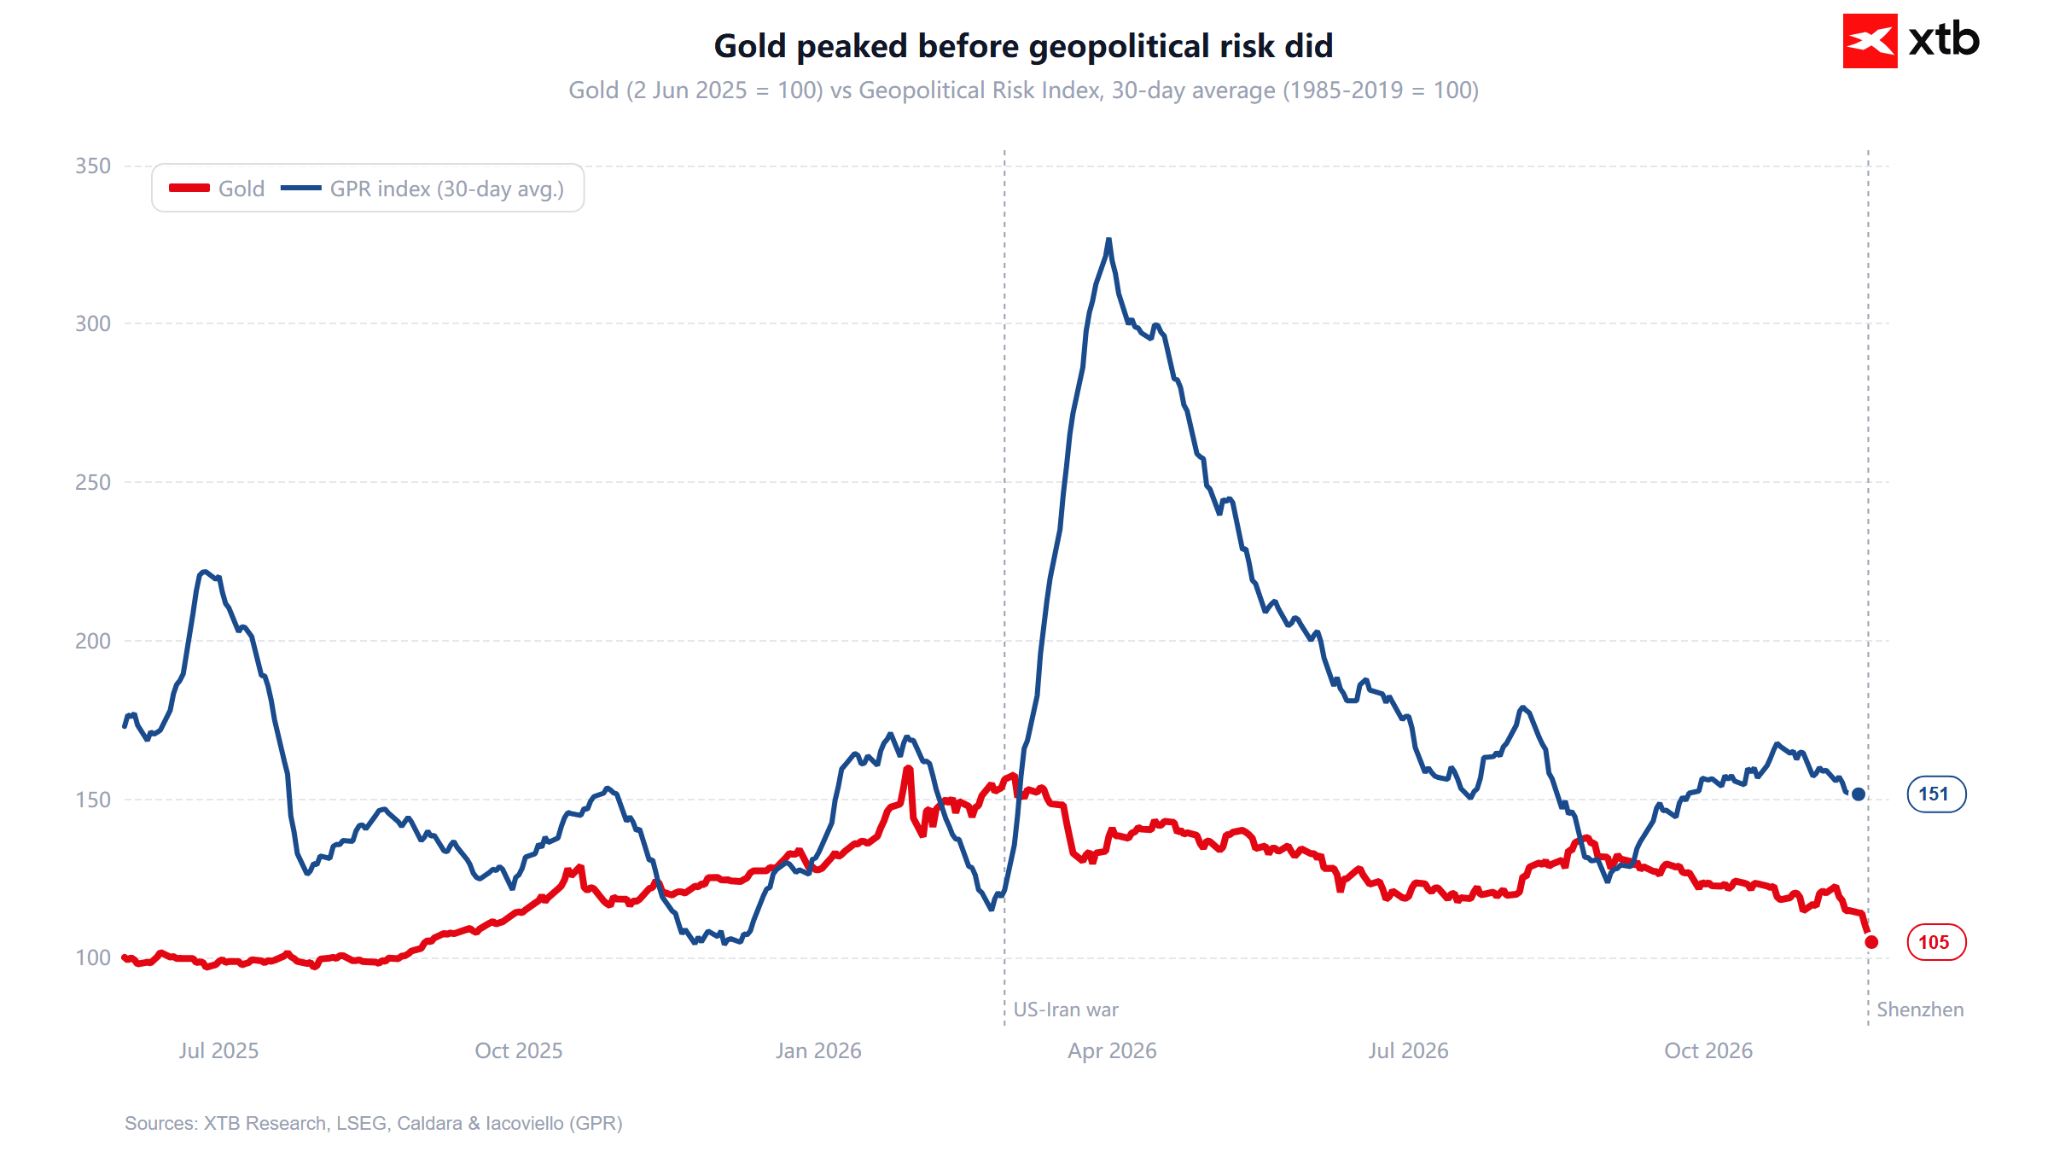
More importantly, gold did not capitalize on geopolitics at all this year. The Geopolitical Risk Index GPR (Caldara & Iacoviello, 30-day average) peaked at the end of March at 327. Gold was falling during the same period, because war meant higher oil prices, higher inflation, and a more hawkish Fed. Today, the GPR stands around 151, still above normal, but far from its peak. Paradoxically, if the declaration on boosting fuel supplies actually lowers energy prices, it could help gold in the longer term by easing pressure for interest rate hikes.
What could stop the decline?
- Physical demand: premiums in India rose to $17/oz (from $8 a week ago) during the peak wedding season. Parts of the market face shortages of physical gold and silver. In China, premiums range from $9–$13, with investors treating the correction as a buying opportunity.
- Technical levels: technical analysis points to an extremely oversold market. Reuters articles highlight a support zone at $3,442–$3,474. Global X sees "very weak support" only around $3,300–$3,400.
- Speculative positioning in the CFTC report shows a relatively low number of long positions. Typically, reaching around 200,000 long positions led to a fairly quick rebound. However, it's worth noting that net positioning is not particularly low, primarily due to a very small number of short positions.
- Warning signals: Swiss gold exports fell 34% MoM in October to 109.7 tonnes, mainly due to lower shipments to London. ETFs have begun selling gold, silver, and platinum.
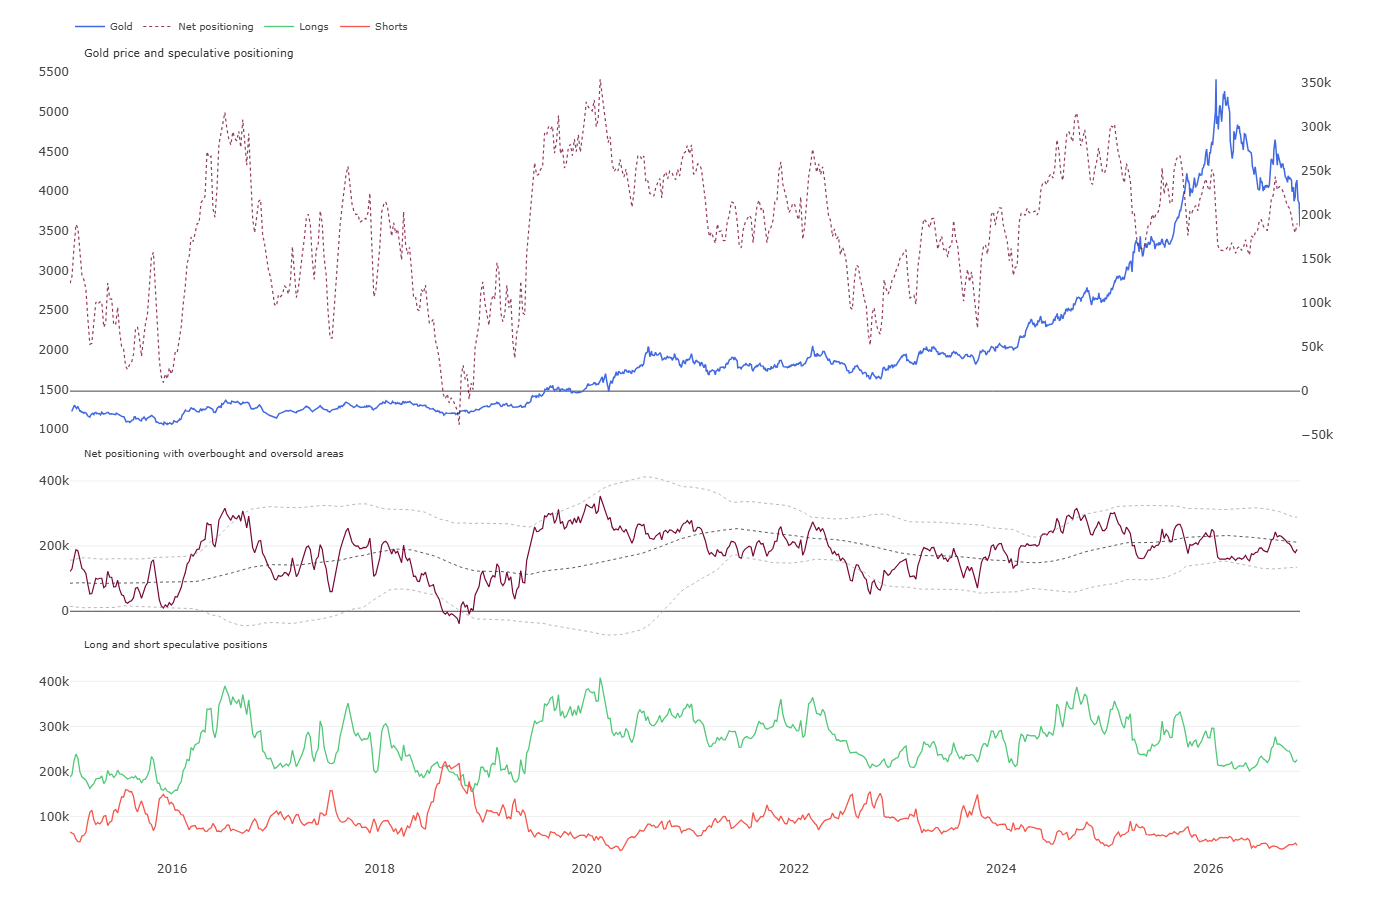 Speculative positions according to COT report, CFTC. Source: CFTC, COT
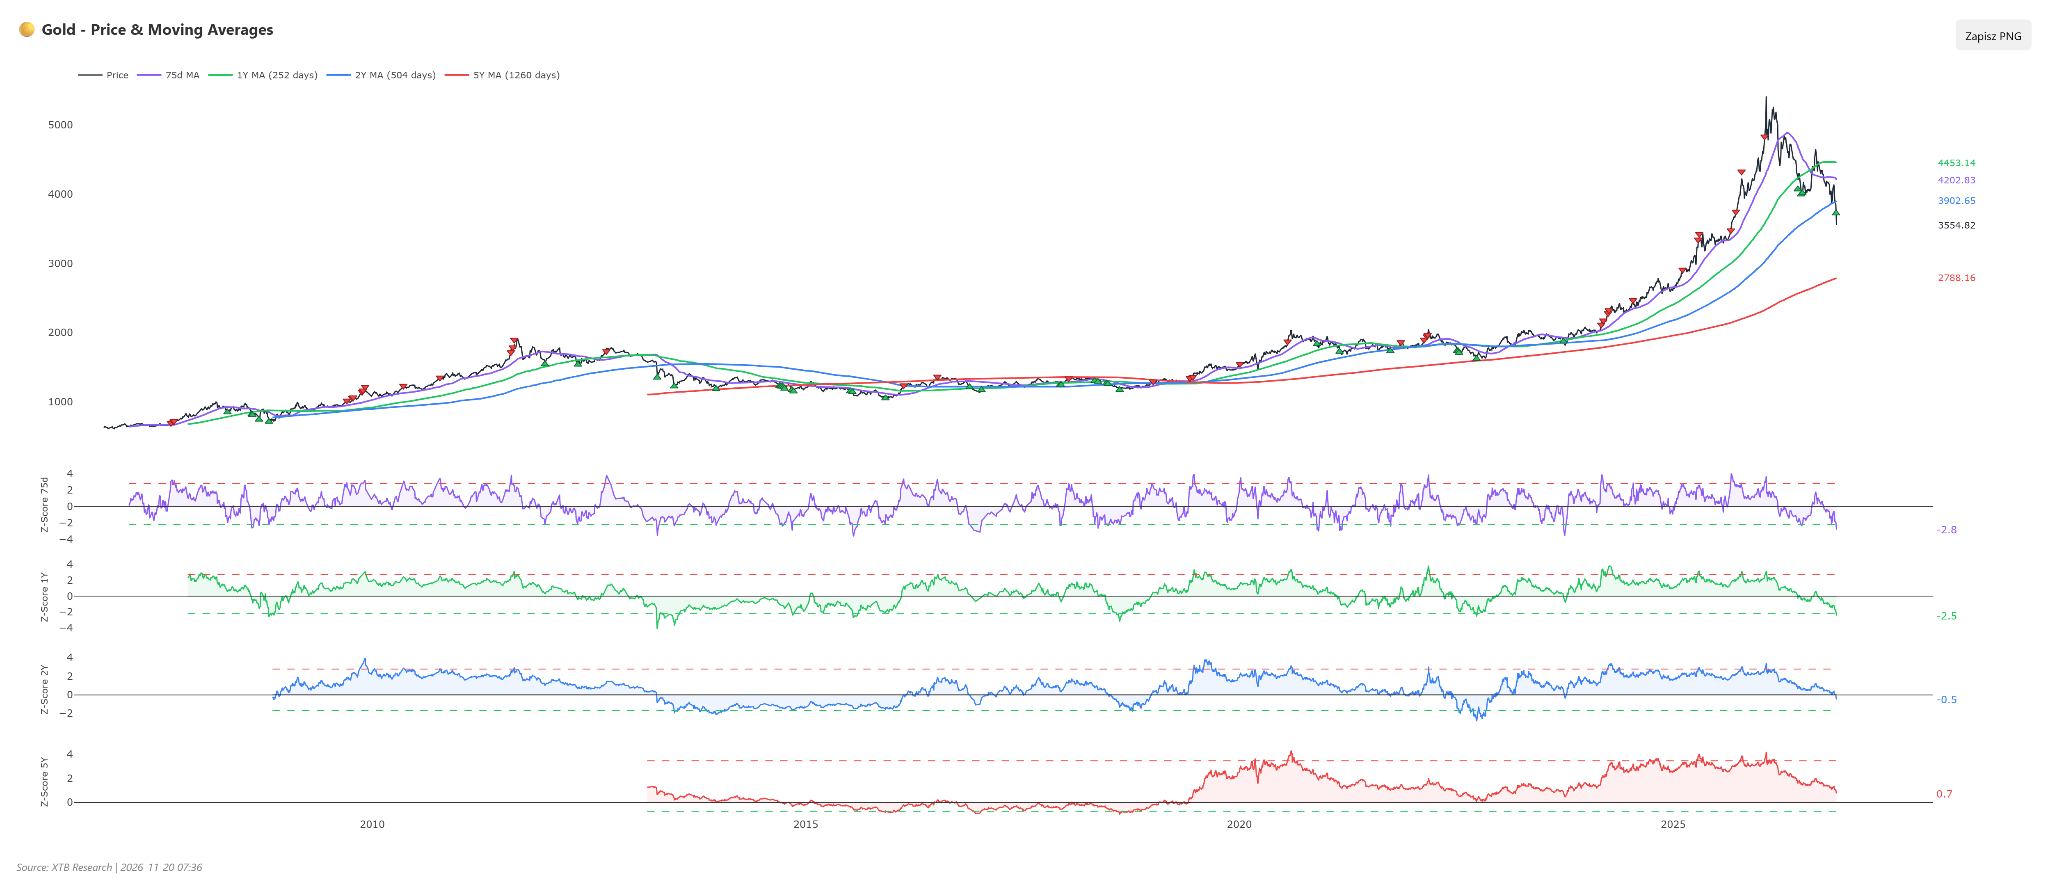 Deviations from the 75-session and 1-year moving averages are starting to yield "weak" oversold signals. A strong signal occurs after crossing back above the deviation from below. Source: XTB
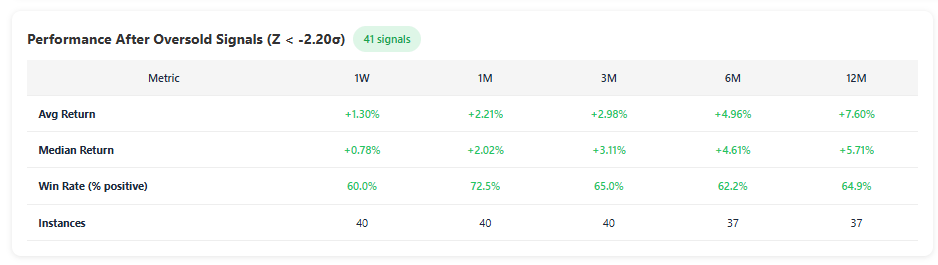 Price performance after crossing extreme deviations from the 75-session moving average shows that in at least 60% of cases, rebounds occurred after such signals were generated. On a one-month horizon, it rises to 70%. Source: XTB
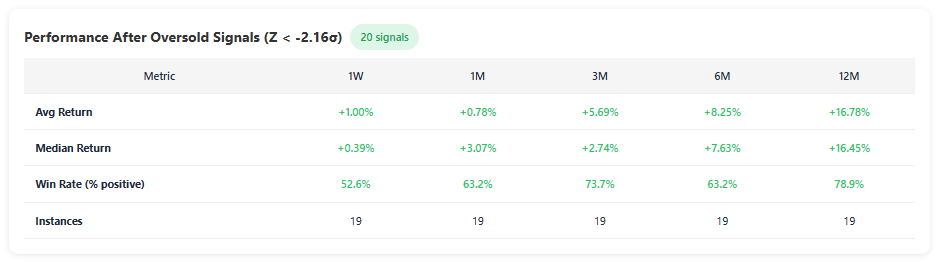 Gold price performance after crossing extreme deviations from the 1-year moving average. Source: XTB
Technically, we are in no man's land. Support levels derived from price peaks lie above $3,400. We broke below the 50.0% Fibonacci retracement of the entire upward wave and the 61.8% expansion of the last major downward impulse. Further Fibonacci supports are at $3,260 and $3,060. Nevertheless, it is worth noting the extremely low RSI, which earlier this year generated signals for short-term rebounds. Source: xStation5
Summary
The sell-off in gold has three layers. The foundation is interest rates and the dollar: war, which was expected to support gold, fueled inflation and reversed the Fed's policy trajectory. The accelerator is liquidity: a crash in AI stocks forces the sale of profitable assets, and gold has been highly correlated with equities this year. The Shenzhen summit is background noise in this context, not the underlying cause. The price action resembles March 2020, but that rebound was created by the Fed cutting rates to zero and driving real yields into negative territory. Today, the Fed is doing the opposite. A repeat of 2020 is only possible if the market forces the Fed to pivot. Until then, stabilization anchored by physical demand is more likely than a rapid recovery.
Michał Stajniak, CFA
Head of Research at XTB
michal.stajniak@xtb.pl


Economic Calendar: Trump-Xi Jinping-Putin summit ongoing, time for Walmart results (19.11.2026)


Morning Wrap: Time for the largest stock market debut in history (19.11.2026)



🟡⬇️Gold below 3800 USD for the first time in over a year


📉Daily Summary: Hawkish Fed and fading optimism around Nvidia hit markets. Gold near 3700
This content has been created by XTB S.A. This service is provided by XTB S.A., with its registered office in Warsaw, at Prosta 67, 00-838 Warsaw, Poland, entered in the register of entrepreneurs of the National Court Register (Krajowy Rejestr Sądowy) conducted by District Court for the Capital City of Warsaw, XII Commercial Division of the National Court Register under KRS number 0000217580, REGON number 015803782 and Tax Identification Number (NIP) 527-24-43-955, with the fully paid up share capital in the amount of PLN 5.869.181,75. XTB S.A. conducts brokerage activities on the basis of the license granted by Polish Securities and Exchange Commission on 8th November 2005 No. DDM-M-4021-57-1/2005 and is supervised by Polish Supervision Authority.