
- After a series of weak economic data, is the UK performing worse than its peers?
- What does a rapidly rising unemployment rate mean for the future
- What negative data surprises are worse for the UK than elsewhere
- After a series of weak economic data, is the UK performing worse than its peers?
- What does a rapidly rising unemployment rate mean for the future
- What negative data surprises are worse for the UK than elsewhere
UK labour market data for the three months to September was weak, and the signs also point to weakness for October. The number of people on the payroll is falling, and the unemployment rate rose in Q3 to a pandemic high. Although the number of job vacancies is stable, the number of candidates per job is rising, and it could be harder to find work if the current labour market trends continue. The question now is, what is causing the labour market slowdown, is it global factors, or is the UK in a unique position?
We have analyzed two data sets to try and answer this question. The first is looking at the UK’s unemployment rate versus its peers. As you can see in the chart below, the UK does not have the highest unemployment rates. Germany and France have significantly higher rates of unemployment than the UK, in France it stands at 7.6% and in Germany, the rate is 6.3%. It’s obviously difficult to compare the UK to the US right now, since economic data releases have been delayed due to the government shutdown. However, prior to the government shutdown, the August unemployment rate in the US was 4.3%.
The chart below has been normalized to show how the unemployment rates in the US, UK, France and Germany move together, and this is where the picture starts to look murky for the UK. There has been a steeper uptrend in unemployment in the UK since the start of the year vs. its peers, and the pace of increase is now faster than France’s.
Thus, the direction of travel seems to be a rapidly deteriorating labour market picture in the UK, that is worse than its main global peers.
Chart 1: UK (white line), France and Germany unemployment rates, normalized to show how they move together.
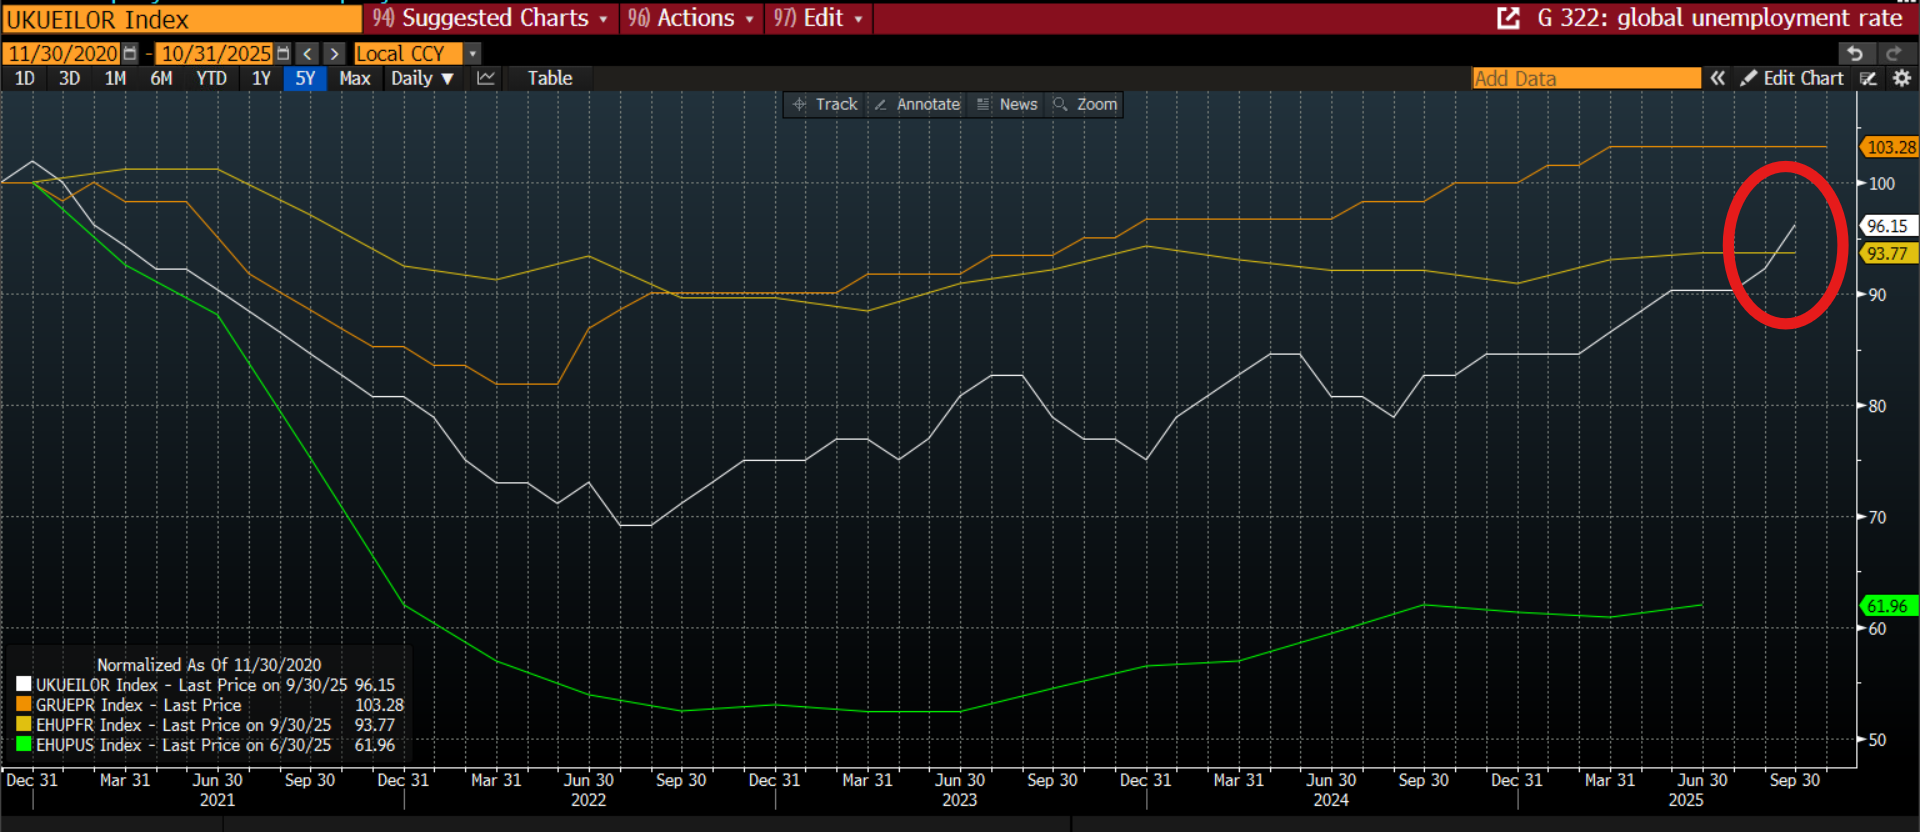
Source: XTB and Bloomberg
But is the UK an outlier by other measures? Another way to compare the UK economy is to look at the UK’s economic surprise index relative to its peers. The chart below looks at the Citi Economic Surprise Index for the US, UK, Eurozone and Global. As you can see, there is clear gap, with economic data in the US and the UK surprising on the downside, while Eurozone and global data are surprising on the upside.
However, the UK’s economic surprise index has turned sharply lower, and is worse than its peers. This suggests that the economic picture is deteriorating in the UK, and it is worse than global trends.
Chart 2: Citi Economic Surprise Index for UK, Eurozone, US and Global
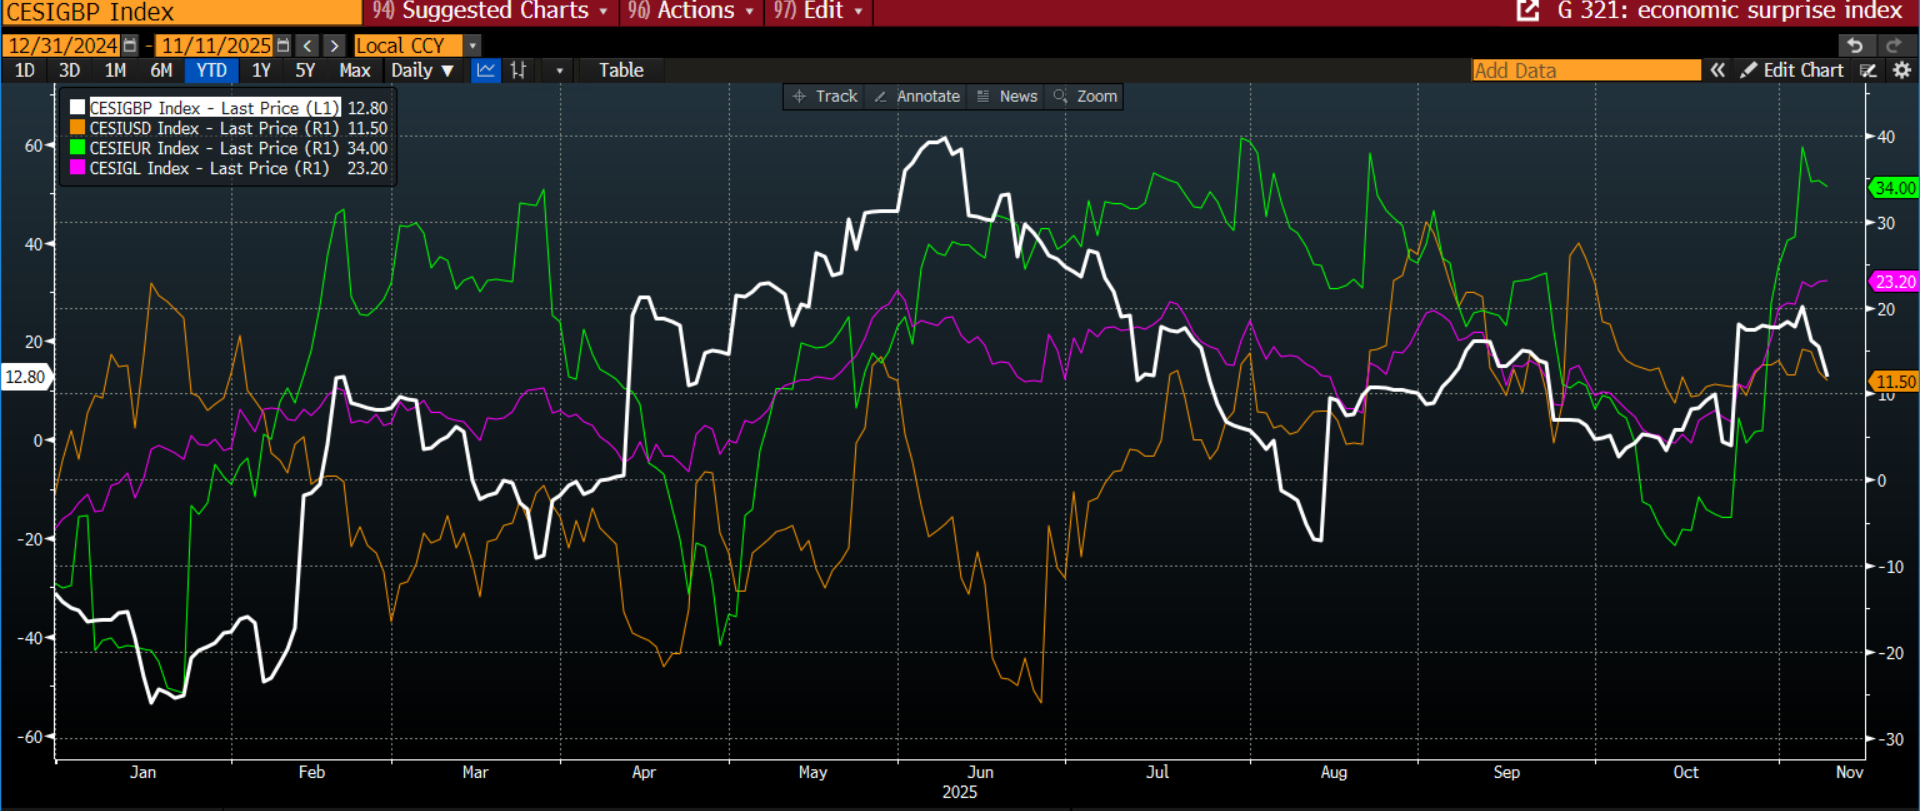
Source: XTB and Bloomberg
Why the future is bleak for the UK
Overall, these two data sets suggest two things: 1, that the path of least resistance is for a weaker economy in the UK, so there could be further bad news to come. 2, the pre-budget media storm is not giving many pro-growth vibes, so there is nothing to stop the UK economy from deteriorating further.
Some will argue that the government’s decisions, for example, higher employer national insurance, large increases to the national living wage, and an employee rights bill, all in a matter of months, is breaking the UK labour market. The data would support this. Added to this, higher income taxes in this month’s budget could trigger even more economic decline.

Daily Summary: Will the S&P 500 close the week with a loss❓Find out what drove the market today ⬇️

Three Markets to Watch Next Week: EURUSD, Gold, S&P 500 (26.06.2026)

Fed's Kashkari says AI will force a rate hike; EURUSD and USD reverse early moves ❗

University of Michigan sentiments lower than expected
This content has been created by XTB S.A. This service is provided by XTB S.A., with its registered office in Warsaw, at Prosta 67, 00-838 Warsaw, Poland, entered in the register of entrepreneurs of the National Court Register (Krajowy Rejestr Sądowy) conducted by District Court for the Capital City of Warsaw, XII Commercial Division of the National Court Register under KRS number 0000217580, REGON number 015803782 and Tax Identification Number (NIP) 527-24-43-955, with the fully paid up share capital in the amount of PLN 5.869.181,75. XTB S.A. conducts brokerage activities on the basis of the license granted by Polish Securities and Exchange Commission on 8th November 2005 No. DDM-M-4021-57-1/2005 and is supervised by Polish Supervision Authority.