
Summary:
- The S&P500 index reached the intraday all-time high on Tuesday
- Technical indicators suggest that rally is not as overheated as it was in January
- We point at some interesting valuation metrics
When the US stocks tumbled back in February some could see the 9-year old bull market as done. However, once again the US stocks recovered and on 21 August set the all-time high, at least for the S&P500. As usual, this raises a question: how long this bull market could last? We present 5 charts that traders might find interesting.
Price chart – momentum lower than in January
As stunning as it might be but the latest very aggressive leg of the bull market is technically still alive. Despite a harsh February correction the US500 (S&P500 futures underlying) remains above the trend line. What is more, it’s not even lose to an upper limit of the upwards channel. The other way to show it is to use the 100-day momentum indicator which – unlike in late January – is also not at the extreme point.
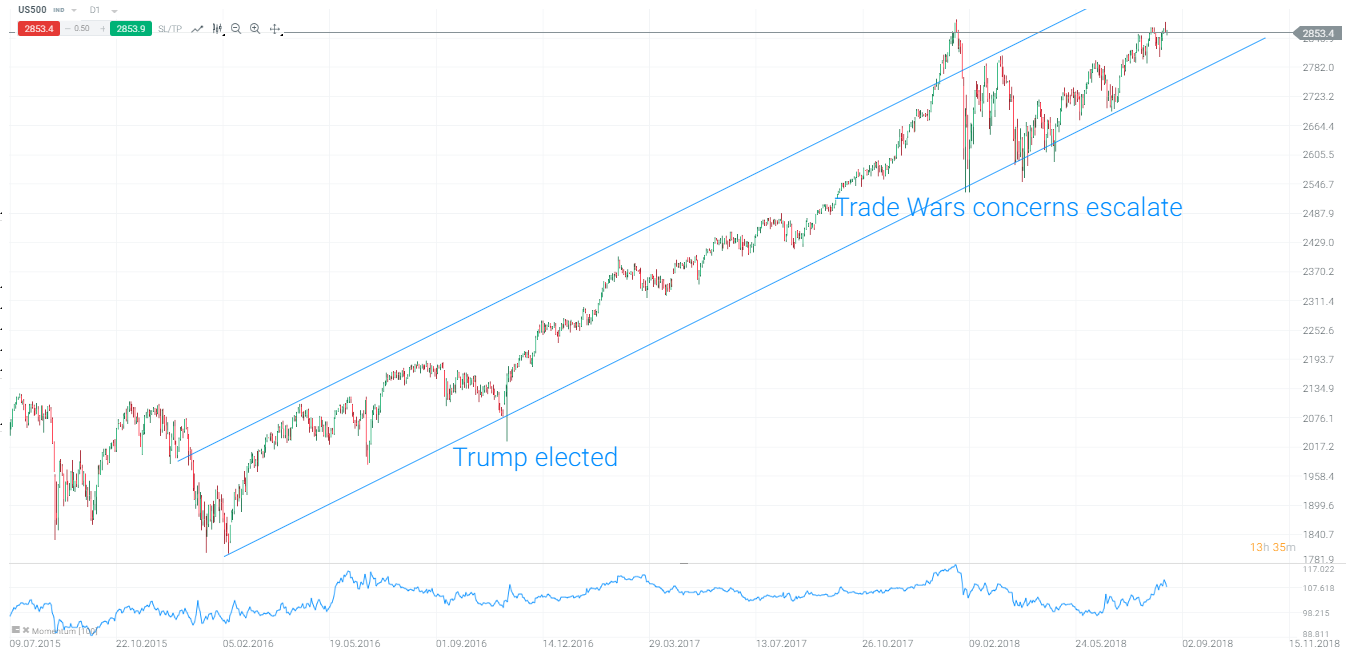 Despite Trade Wars in the making, US500 trend line keeps acting as a support. Source: xStation5
Sentiment indicator – positive but not extreme
The price chart seems to find some confirmation in the sentiment analysis. We calculate the sentiment index based on indicators like investors sentiment, market breadth, economic surprise index, deviation from trend and put/call ratio from the options market. We can see that the index is in the positive territory but – again unlike in January – the level is not extreme. Extreme optimism may lead to overconfidence and is often treated as a contrarian indicator.
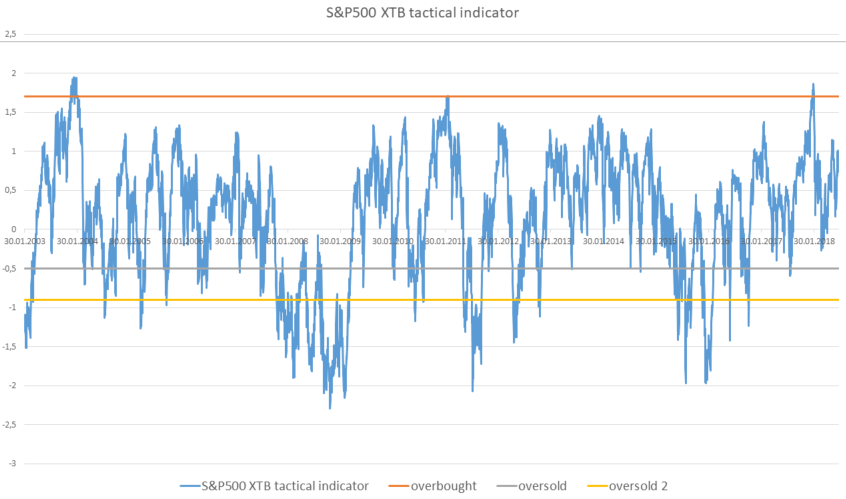 Equity sentiment remains positive and - while above average - is not at the extreme level. Source: XTB Research
Earnings growth – could S&P500 stocks keep outperforming the broader economy?
One of the factors behind the S&P500 rally is earnings growth. After a slump in 2016 (partially related to energy stocks that suffered amid low oil prices) S&P500 EPS growth surged to double digits in 2017 and has stayed there this year, not least thanks to corporate tax cuts. However, we may notice that this bonanza is not shared with the broad US economy where corporate earnings (before taxes) have been actually declining! Could S&P500 giants keep outperforming the broad economy going forward?
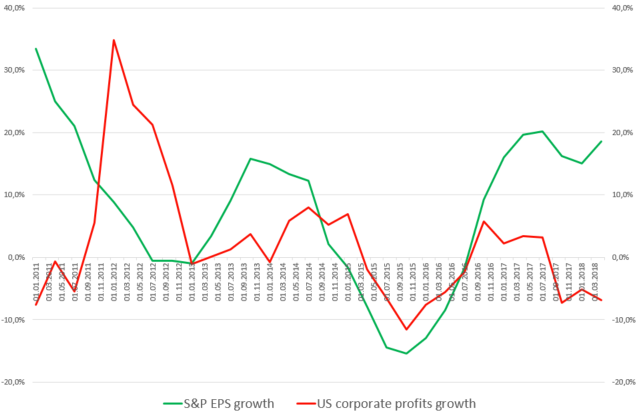 US giants increase their profits but a broader economy does not enjoy a similar bonanza. Source: Macrobond
Margin debt – is this a vital concern?
Margin debt is being used to buy stocks with a borrowed money. The reason why some analysts look at this category is that a lot of margin debt can augment a sell-off if investors need to repay their debts. We can see that a share of margin debt in the US GDP peaked at around 3% just towards the end of the previous 2 market cycles! However, this time the measure has broken the 3% barrier and remains elevated. Is this a reason for concern?
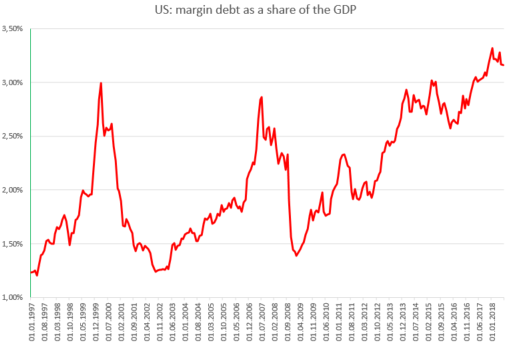 A margin debt/GDP ratio remains above highs from past cycles. Source: Macrobond
P/S ratio – climbing higher
We have noticed a positive earnings story on Wall Street but earnings can only rise for some time if sales lags behind. We may notice that the price to sales ratio has been rising steadily and is already way above the levels from 2007 (peak of the previous bull market) and approaching highs from the 2000 peak.
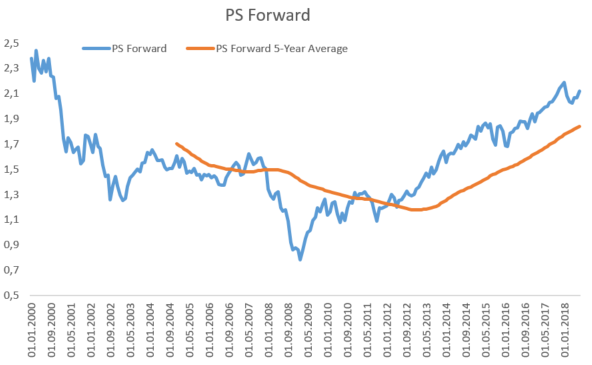 There is no single critical level for the price/sales ratio but the one for the S&P500 has climbed way above the 5-year average. Source: Bloomberg, XTB Research
This content has been created by XTB S.A. This service is provided by XTB S.A., with its registered office in Warsaw, at Prosta 67, 00-838 Warsaw, Poland, entered in the register of entrepreneurs of the National Court Register (Krajowy Rejestr Sądowy) conducted by District Court for the Capital City of Warsaw, XII Commercial Division of the National Court Register under KRS number 0000217580, REGON number 015803782 and Tax Identification Number (NIP) 527-24-43-955, with the fully paid up share capital in the amount of PLN 5.869.181,75. XTB S.A. conducts brokerage activities on the basis of the license granted by Polish Securities and Exchange Commission on 8th November 2005 No. DDM-M-4021-57-1/2005 and is supervised by Polish Supervision Authority.