
The Q4 2025 earnings season on Wall Street turned out better than the market had anticipated: with 96% of companies having reported, about 73% beat EPS estimates and 73% delivered positive revenue surprises. This suggests that the market’s fundamental breadth has improved, even if equity sentiment remains subdued. A strong quarter may lay the groundwork for a rebound in the coming months, yet investor reaction so far has been muted. At the same time, we have seen the first downward revisions to U.S. corporate earnings forecasts since Q2 2025. Here are the key takeaways from the FactSet report.
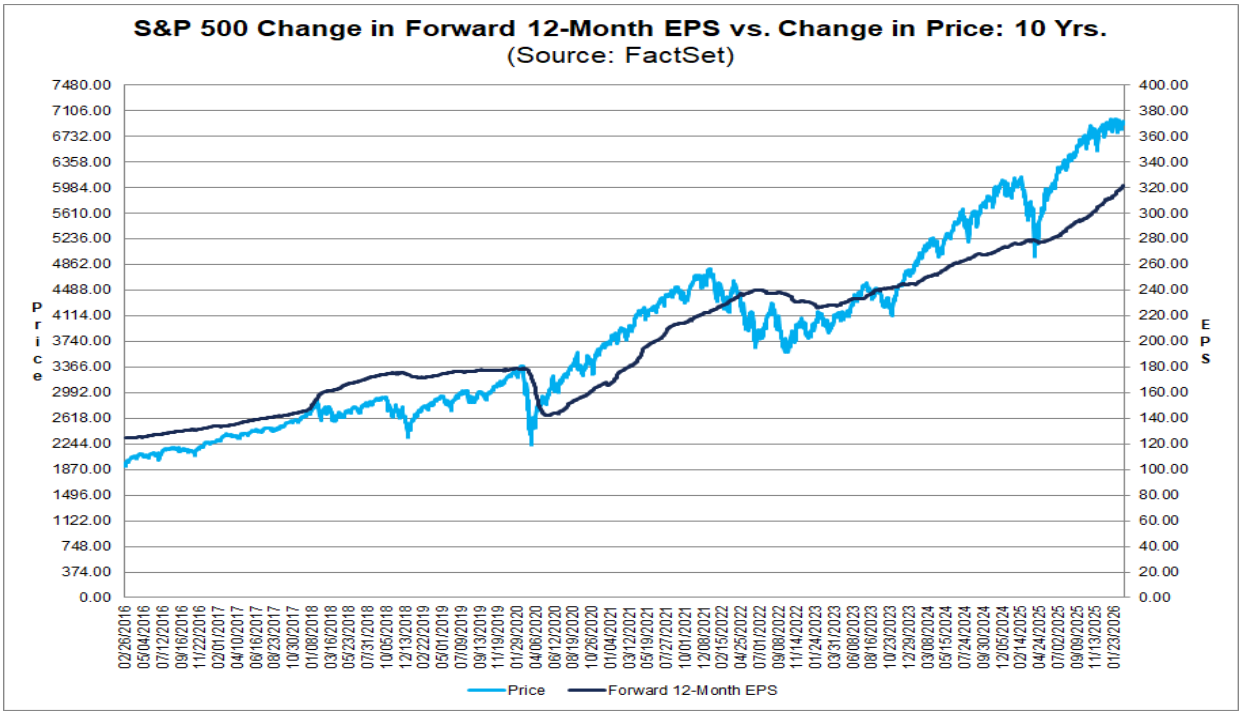
- Earnings are driving solid index-level growth: the blended year-over-year growth rate of 14.2% for Q4 2025 puts the S&P 500 on track for a fifth consecutive quarter of double-digit earnings growth — a strong argument for the resilience of margins and demand.
- Revisions moved sharply higher during the season: the market started with expectations of 8.3% YoY growth (as of December 31), and that figure now stands at 14.2%, reflecting a wave of positive surprises. As many as 10 of 11 sectors are showing a stronger earnings picture than at the start of the season.
- Guidance for Q1 2026 is mixed, but far from capitulation: 52 companies issued positive or raised EPS guidance, while 45 lowered it - a slightly positive balance, pointing to cautious optimism despite ongoing cost and demand risks.
- Valuations remain elevated, raising the bar for the coming quarters: the forward 12-month P/E ratio stands at 21.6, above both the 5-year average (20.0) and the 10-year average (18.8). The market is already “paying” for continued strong performance, meaning any disappointment in earnings momentum or guidance could weigh more heavily on sentiment.
Source: FactSet
The “Magnificent 7” (M7) companies closed out the Q4 season with Nvidia's report on February 25, allowing for a full assessment of how much this group continues to drive overall S&P 500 performance.
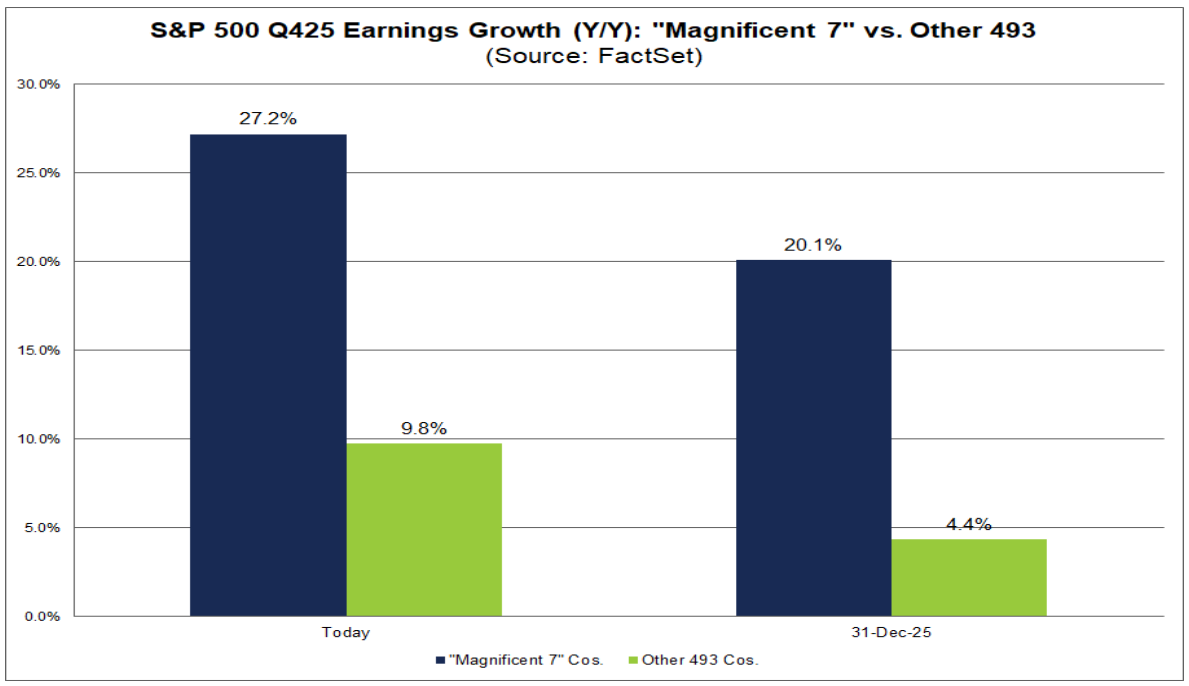
- Consensus expectations for the group rose significantly during the season: as of December 31, the market expected 20.1% earnings growth for Q4; the final figure came in at 27.2%.
- In terms of surprise quality: there were more beats, but of smaller magnitude.
- 86% (6 out of 7) of M7 companies beat EPS estimates (vs. 73% for the broader S&P 500).
- However, the aggregate EPS surprise for M7 was 5.5%, compared with 6.8% for the full index.
- Earnings momentum within M7 accelerated versus Q3: Q4 growth reached +27.2% YoY, up from +18.4% YoY in Q3. Notably, this marks the 10th time in the past 11 quarters that M7 has delivered earnings growth above 25% - underscoring the ongoing concentration of profit growth in the largest names.
- The rest of the market is slowing: the remaining 493 companies posted blended earnings growth of around 9.8% in Q4, below their Q3 pace of approximately 12.2%, widening the divergence between M7 and the broader index once again.
- Who is truly driving S&P 500 earnings growth? Three of the top five contributors are M7 constituents: NVIDIA, Alphabet, and Microsoft. Without these three, the index-level earnings narrative would look materially less impressive.
A note of caution on one-offs among the other top contributors: Boeing and GE Vernova entered the top five largely due to significant non-recurring items (approximately $9.6 billion in gains related to the Digital Aviation Solutions transaction for Boeing, and roughly $2.9 billion in tax benefits from a valuation allowance release for GE Vernova). Adjusting for these effects is crucial when assessing underlying earnings trends.
Source: FactSet
Looking ahead, the market is pricing in double-digit earnings growth for 2026: analysts expect roughly 23.5% growth for M7 and 11.8% for the other 493 companies in calendar year 2026 — ambitious expectations that also assume broader participation beyond megacap tech.
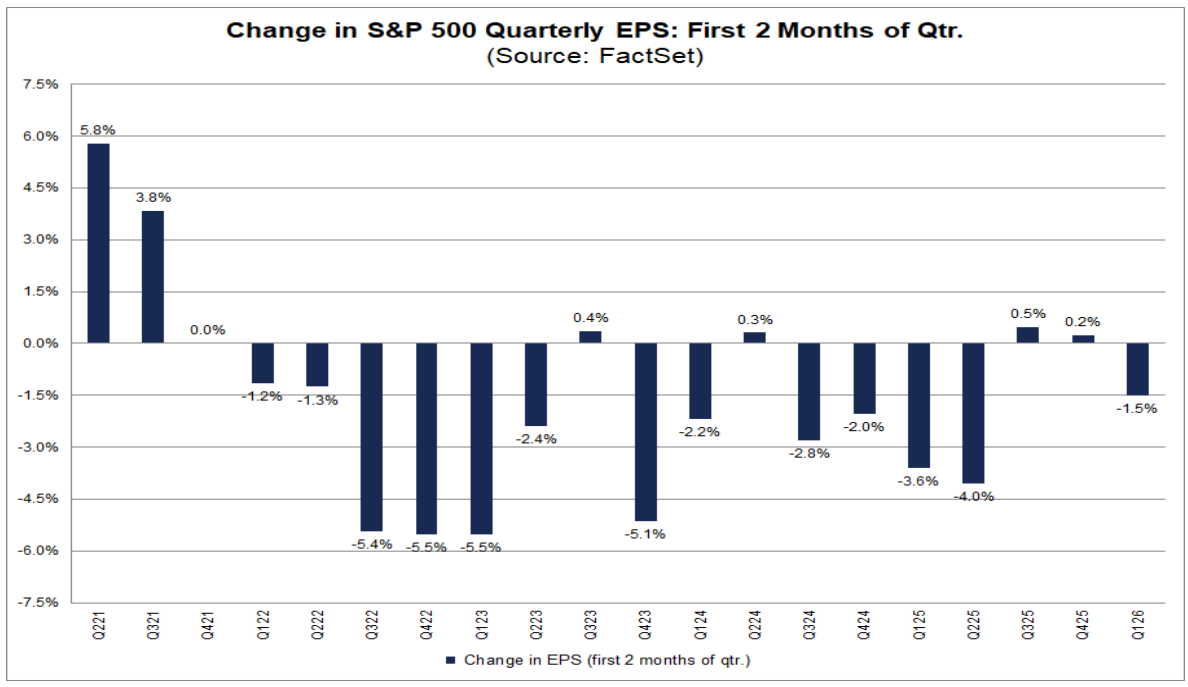
- Analysts have begun cutting Q1 estimates — the first such move since Q2 2025. In January and February, the bottom-up EPS consensus for the S&P 500 for Q1 declined by 1.5% (from $71.57 to $70.50), formally ending a period of stabilization and upward revisions at the start of quarters.
- However, the scale of cuts remains moderate by historical standards. The average decline in the first two months of a quarter has been: –1.2% (5-year average), –2.4% (10-year), –2.6% (15-year), and –3.2% (20-year). The current –1.5% is below longer-term averages, suggesting normalization rather than an aggressive downgrade cycle.
Revision pressure is broad across sectors: 8 of 11 sectors saw Q1 2026 EPS estimates reduced, led by:
- Health Care: –13.2%
- Energy: –12.3%
On the other side, Information Technology rose by +5.2%, while Utilities were unchanged.
The market is pricing in near-term risks (inflation, tariffs, AI-related uncertainty), but it is not abandoning the second-half recovery narrative. During the same period, estimates for the remaining quarters of 2026 were revised higher:
- Q2: +0.7% (to $76.78)
- Q3: +1.2% (to $82.39)
- Q4: +2.2% (to $85.18)
As a result, full-year consensus is also rising. The CY 2026 EPS estimate increased by 0.8% (to $313.62), despite a softer start to the year — the market appears to be pushing earnings acceleration further out, rather than canceling it.
- At the sector level, the 2026 picture is mixed but tilted positive: 6 sectors saw upward revisions (led by Information Technology +4.1% and Materials +2.9%), while 5 recorded cuts (most notably Energy –6.5% and Health Care –2.3%).
- Market takeaway: the short-term reset in expectations does not undermine the medium-term thesis of double-digit earnings growth in 2026. However, with S&P 500 valuations elevated, the margin for error in Q1 remains limited.
Source: FactSet
US500 (D1 interval)
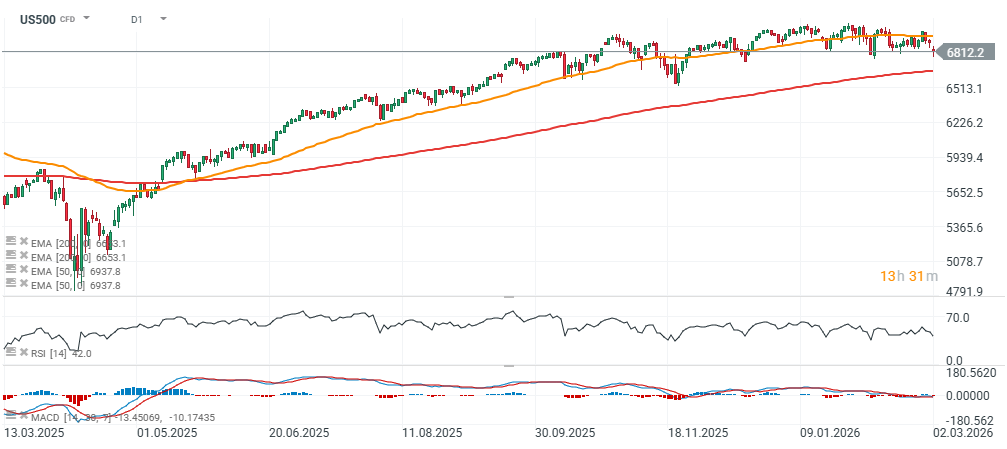
Source: xStation5

Daily Summary: Trump's War Threats Weigh on Markets. Wall Street Sinks into the Red
Stock of the Week: TSMC – The Manufacturing Engine Behind the AI Revolution
Tensions around Iran weigh on markets!

US Open: Alphabet and Tesla Weigh on Wall Street, While Oil Prices Renew Investor Concerns
This content has been created by XTB S.A. This service is provided by XTB S.A., with its registered office in Warsaw, at Prosta 67, 00-838 Warsaw, Poland, entered in the register of entrepreneurs of the National Court Register (Krajowy Rejestr Sądowy) conducted by District Court for the Capital City of Warsaw, XII Commercial Division of the National Court Register under KRS number 0000217580, REGON number 015803782 and Tax Identification Number (NIP) 527-24-43-955, with the fully paid up share capital in the amount of PLN 5.869.181,75. XTB S.A. conducts brokerage activities on the basis of the license granted by Polish Securities and Exchange Commission on 8th November 2005 No. DDM-M-4021-57-1/2005 and is supervised by Polish Supervision Authority.