
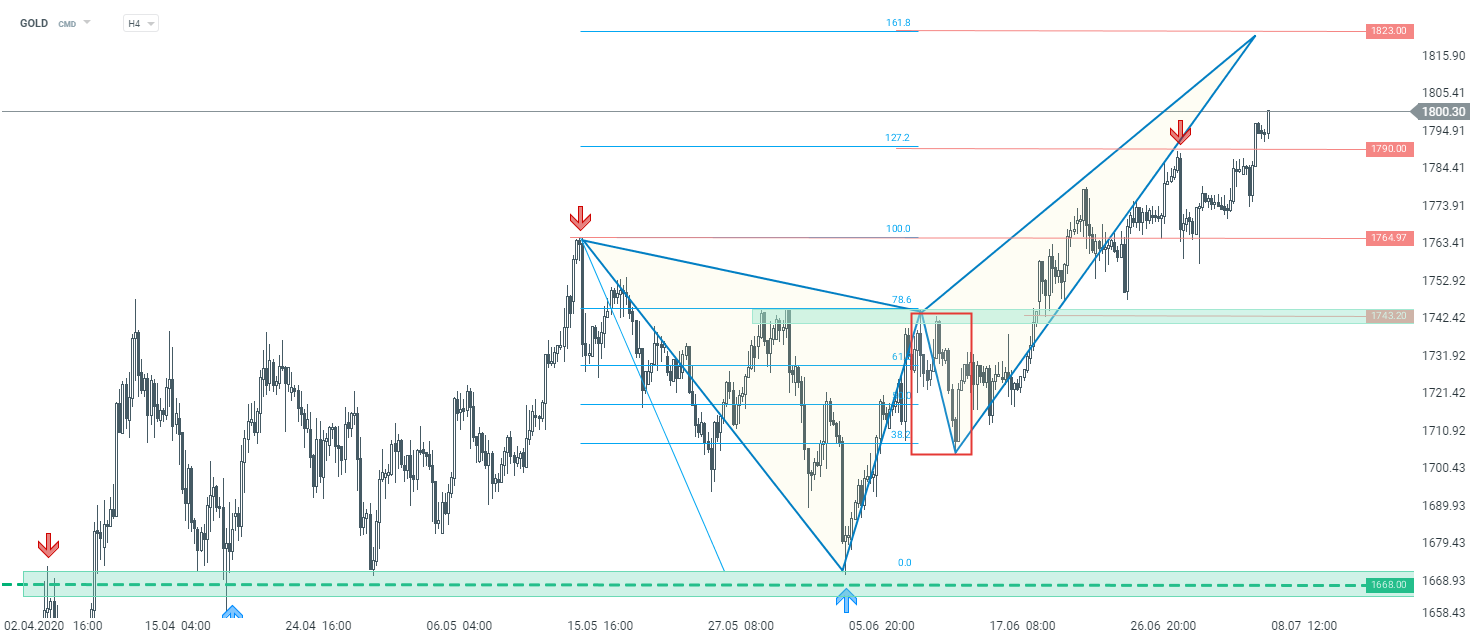
GOLD
Gold has been trading in an upward trend since a considerable period of time. During today's session, price surged to fresh YTD highs and further upward move is the base case scenario. Looking at the chart from the technical point of view, the potential XABCD harmonic pattern in building up. The price broke above the 127,2% Fibonacci retracement, and may be heading toward next 161,8% Fibonacci retracement. The $1823 level should be considered as a key resistance. But in case of downward correction occurs, the nearest support to watch is the $1790 handle. Should the price break below it, next resistance at $1765 and $1743 may come into play.
 US100 D1 interval. Source: xStation5
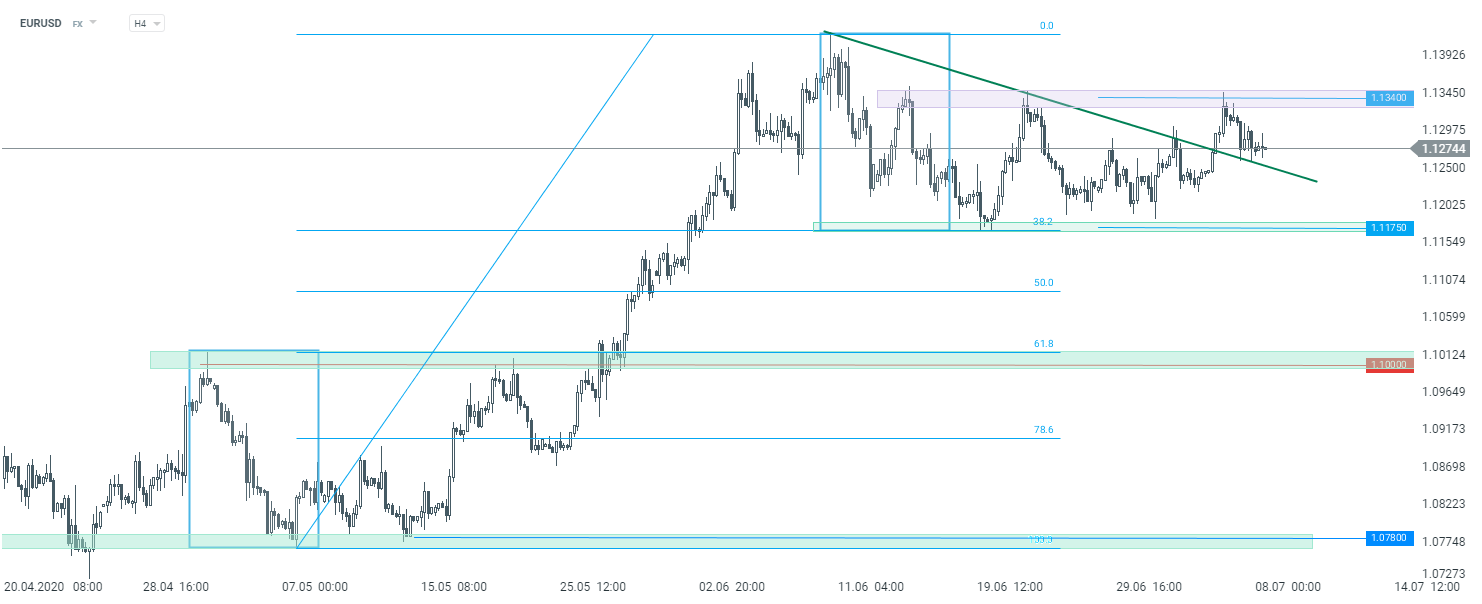
EURUSD
EURUSD has been trading in a sideways move recently. Despite a break above the local trend line, the buyers did not manage to hurdle above the resistance area at 1.1340. However one should remember that any attempt made to break above this level increases the likelihood of further gains. The support zone is marked with the lower limit of 1:1 structure, as well as previous price reactions. The blue rectangle marked on the screen below shows the range of the biggest correction in an upward move which started in May. According to classic technical analysis, as long as the price sits below this resistance, the main trend remains upward. However a break below, may trigger a bigger downward move.
 EURUSD H4 interval. Source: xStation5
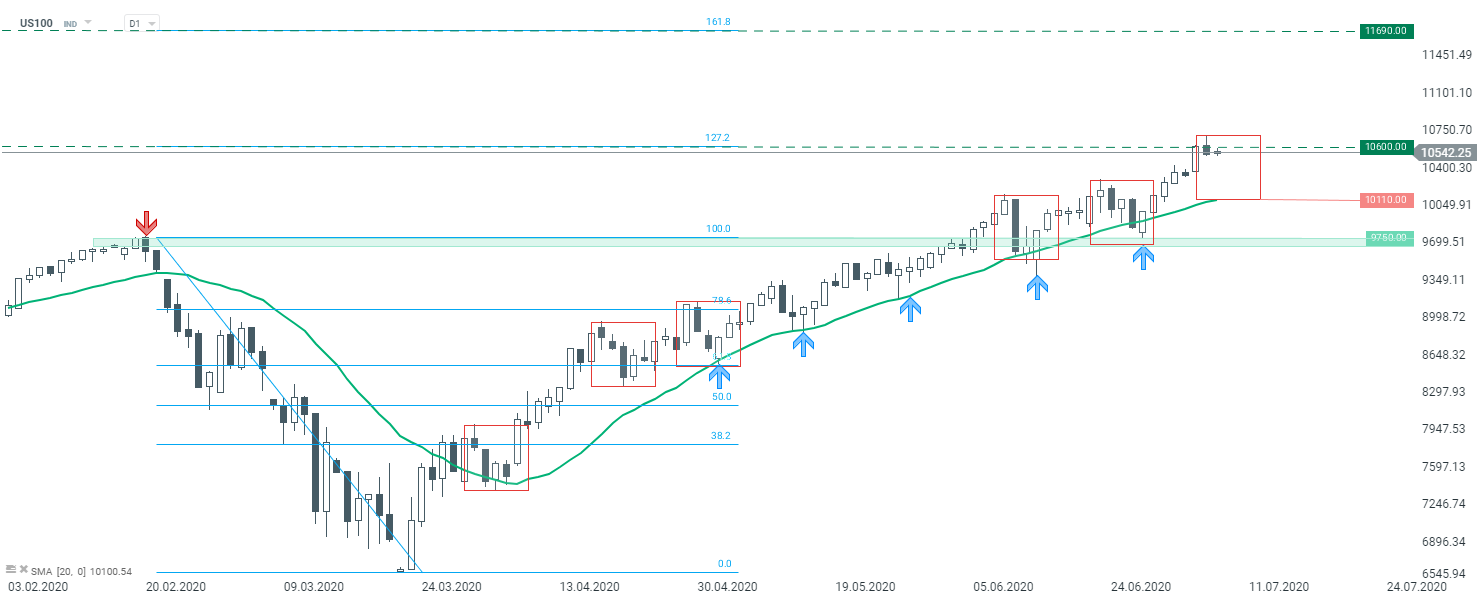
US100
The bullish rally on the US stock market continues. Let’s look at the technical situation on the US tech index. US100 reached the key resistance yesterday. Sellers managed to halt upward move at 127.2% Fibonacci retracement but the main trend remains upward. Nevertheless this level could be a perfect place to start a downward correction. The nearest support to watch is located at 10,110 pts, where the lower limit of 1:1 structure is located. As long as the price sits above market bulls got an advantage. However breaking above the 10,600 pts hurdle may lead to a bigger upward move and 161.8% Fibonacci retracement level could be a potential target (11,690 pts).
 US100 D1 interval. Source: xStation5
Delays at Nvidia: Is the Kyber project at risk?

The defense industry is recouping losses - is this a trend change?
"Rammmagedon” ends up in court: Antitrust lawsuit and investments in Korea

Apple Price Hikes: Memory costs weigh on the company’s and markets
This content has been created by XTB S.A. This service is provided by XTB S.A., with its registered office in Warsaw, at Prosta 67, 00-838 Warsaw, Poland, entered in the register of entrepreneurs of the National Court Register (Krajowy Rejestr Sądowy) conducted by District Court for the Capital City of Warsaw, XII Commercial Division of the National Court Register under KRS number 0000217580, REGON number 015803782 and Tax Identification Number (NIP) 527-24-43-955, with the fully paid up share capital in the amount of PLN 5.869.181,75. XTB S.A. conducts brokerage activities on the basis of the license granted by Polish Securities and Exchange Commission on 8th November 2005 No. DDM-M-4021-57-1/2005 and is supervised by Polish Supervision Authority.