
Gold is grabbing the headlines today, because, after a stunning rally, the price has fallen $18 so far on Tuesday. Today’s decline comes after a tremendous rally this month, the gold price is higher by more than 10%, that compares to a 3.1% rally for the S&P 500, and a 5.2% gain for the Nasdaq 100.
While the US government shutdown is looming over financial markets, month end flows may also be weighing on asset prices, as investors rebalance their portfolios before we move into Q4.
A pullback in the gold price from here is to be expected, the recent surge in the price of gold is more than two standard deviations compared to its long run mean, and gains could slow from here, as prices tend to mean revert.
However, the longer-term case is still supportive of further increases in the gold price. Dollar weakness, rising inflation expectations and the prospect of Fed rate cuts are all driving this gold rally. Added to this, there are also fears that the boom in AI stocks could be overdone, and that AI might not deliver the productivity and revenue gains that are expected. Gold is the ultimate hedge to dollar debasement, a global debt binge, a stock market bubble and inflation risks. None of these risks have gone away, which could keep demand for gold high.
It is also worth looking at the correlation analysis to see where gold goes next. The gold price has an inverse correlation with the dollar and since the start of this year, the gold price and the dollar have moved inversely to each other more than 50% of the time. As the dollar has fallen, the gold price has rallied.
With few drivers likely to boost the dollar, and a weaker greenback the likely path of least resistance during the expected US government shutdown, the upside momentum in the gold price is still intact, even if gains slow going forward. The yellow metal may not repeat September’s stunning performance, but a future above $4,000 an ounce is still a possibility.
Chart 1: Gold and the US dollar, 5-year chart. The inverse correlation has become notable since the start of this year.
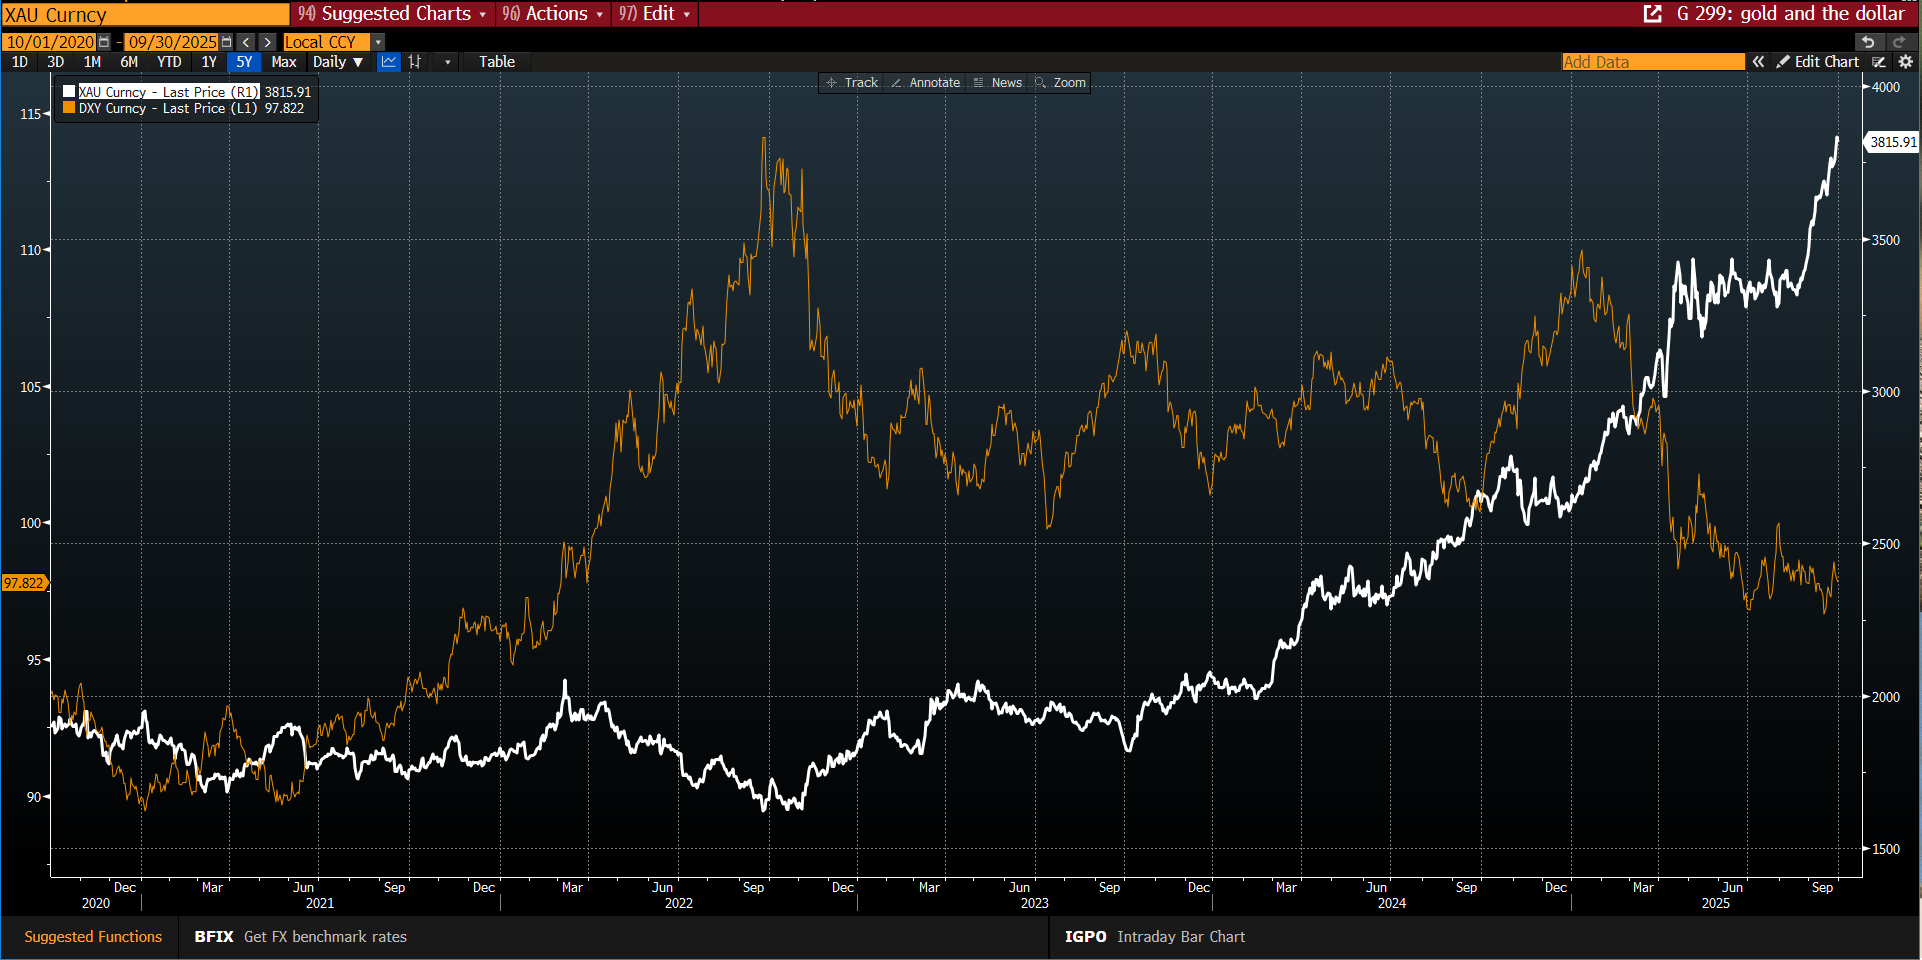
Source: XTB and Bloomberg

Daily Summary: Will the S&P 500 close the week with a loss❓Find out what drove the market today ⬇️

Three Markets to Watch Next Week: EURUSD, Gold, S&P 500 (26.06.2026)
Fed's Kashkari says AI will force a rate hike; EURUSD and USD reverse early moves ❗

University of Michigan sentiments lower than expected
This content has been created by XTB S.A. This service is provided by XTB S.A., with its registered office in Warsaw, at Prosta 67, 00-838 Warsaw, Poland, entered in the register of entrepreneurs of the National Court Register (Krajowy Rejestr Sądowy) conducted by District Court for the Capital City of Warsaw, XII Commercial Division of the National Court Register under KRS number 0000217580, REGON number 015803782 and Tax Identification Number (NIP) 527-24-43-955, with the fully paid up share capital in the amount of PLN 5.869.181,75. XTB S.A. conducts brokerage activities on the basis of the license granted by Polish Securities and Exchange Commission on 8th November 2005 No. DDM-M-4021-57-1/2005 and is supervised by Polish Supervision Authority.