



The EUR/USD pair has become particularly volatile over the past few sessions. After the euro reached new highs this year against the US dollar, nearing 1.12 euros, the pair eventually started to decline again.
However, when we analyze the currency pair on the daily chart, we can see that the price has been slowing down, and the buying strength is picking up near the 50-period EMA (Exponential Moving Average). This will be an important zone to understand whether the euro might (or might not) resume its upward trend against the US dollar.
 EUR/USD, Daily Time Frame Chart. Source: xStation 5
Curiously, when we analyze the chart of the US dollar index, we can see that the index is also testing the 50-period moving average on the D1 (daily) chart.
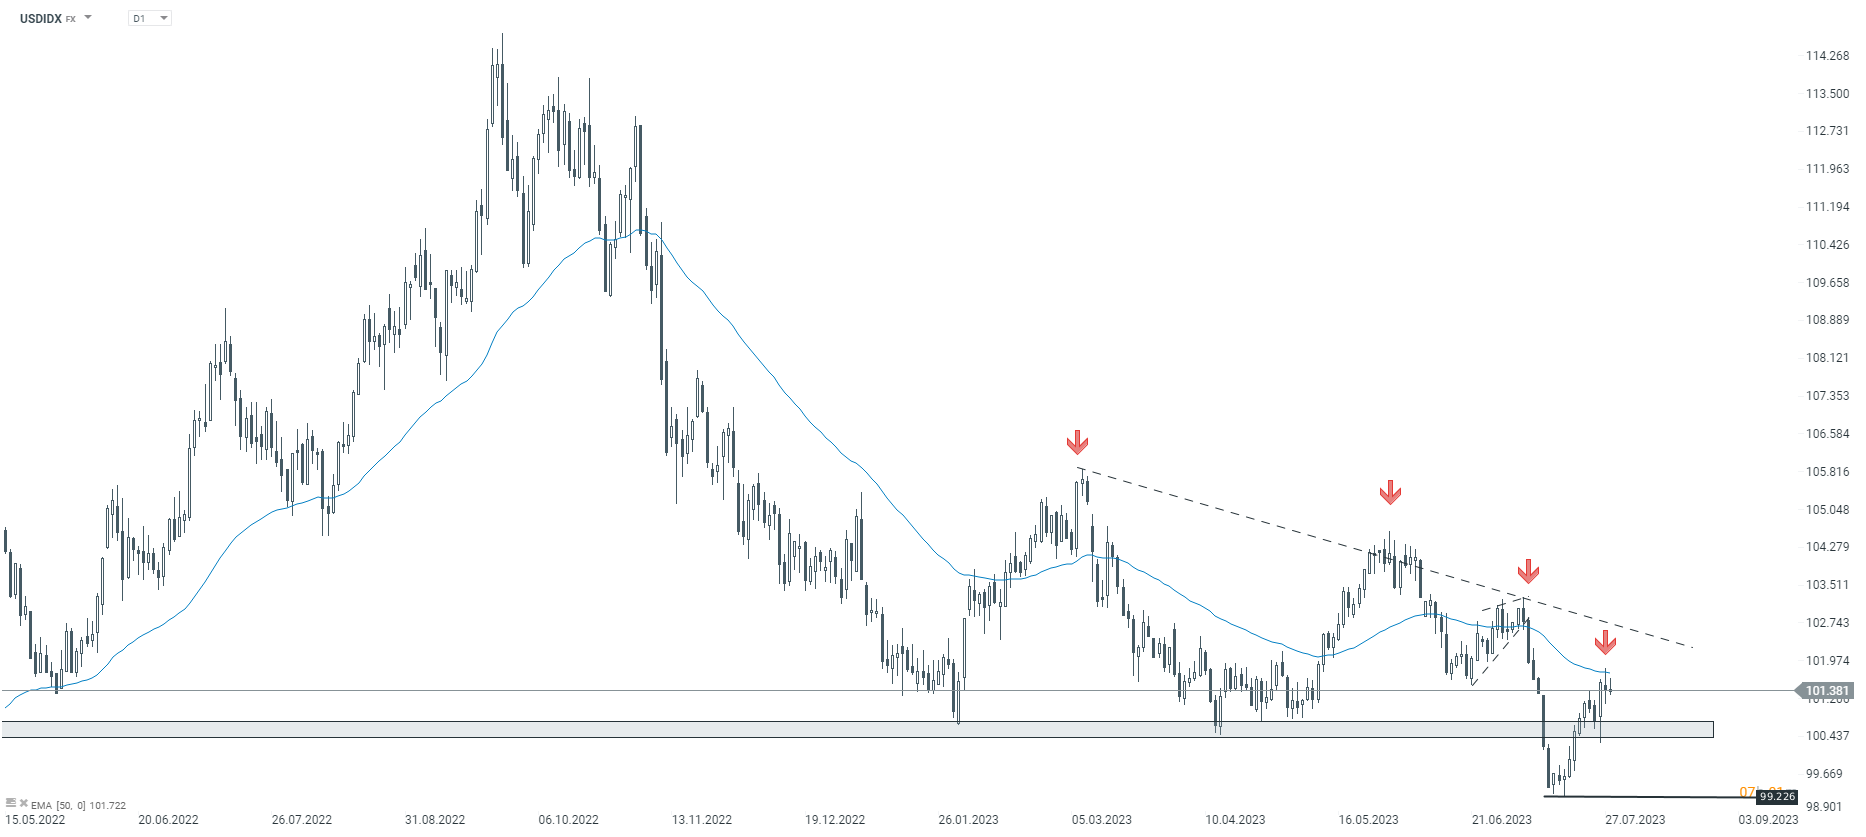 USDIDX, Daily time frame Chart. Source: xStation 5
Henrique Tomé,
Analyst at XTB Portugal



Daily Summary: Tech Stock Selloff Weighs on Markets, Fed Outlines AI Scenarios


Market Wrap: Weak data from Europe and Asia, market awaits Warsh



The Week Ahead


⚪Chart of the Day: Silver. The market tests yearly lows, while fundamentals worsen.
This content has been created by XTB S.A. This service is provided by XTB S.A., with its registered office in Warsaw, at Prosta 67, 00-838 Warsaw, Poland, entered in the register of entrepreneurs of the National Court Register (Krajowy Rejestr Sądowy) conducted by District Court for the Capital City of Warsaw, XII Commercial Division of the National Court Register under KRS number 0000217580, REGON number 015803782 and Tax Identification Number (NIP) 527-24-43-955, with the fully paid up share capital in the amount of PLN 5.869.181,75. XTB S.A. conducts brokerage activities on the basis of the license granted by Polish Securities and Exchange Commission on 8th November 2005 No. DDM-M-4021-57-1/2005 and is supervised by Polish Supervision Authority.