
Volatility refers to the amount of uncertainty, risk and fluctuations that occur on the market and, most often, to the amount of price changes over a given period on the financial markets.
Volatility refers to the amount of uncertainty, risk and fluctuations that occur on the market and, most often, to the amount of price changes over a given period on the financial markets.
In the securities markets, volatility is often associated with big swings in either direction. For example, when the stock market rises and falls more than one percent over a sustained period of time, it is called a "volatile" market.
What Is Volatility?
Volatility often refers to the amount of uncertainty or risk related to the size of changes in a security's value. During high market volatility, prices tend to be very dynamic, and change rapidly over a short time period. This means that the price of the security can change dramatically over a short time period in either direction.
When markets are not volatile or ‘fixed’ market movements and trends are created much more steadily. Volatility may appear in the market after a significant reading of macroeconomic data or after unexpected events, such as a natural disaster or a significant political event.
More experienced traders tend to invest during greater volatility, trying to open and close positions in a very short time.
Types of Volatility
Implied Volatility
Implied volatility (IV) is the market's forecast of a likely movement in a security's price. IV is often used to price options contracts where high implied volatility results in options with higher premiums and vice versa. Supply and demand, as well as time value are major determining factors for calculating implied volatility.
Historical Volatility
Historical volatility (HV) is a statistical measure of the dispersion of returns for a given security or market index over a given period of time. Generally, this measure is calculated by determining the average deviation from the average price of a financial instrument in the given time period. The higher the historical volatility value, the riskier the security. However, that is not necessarily a bad result as risk works both ways; bullish and bearish.
Volatility in Action
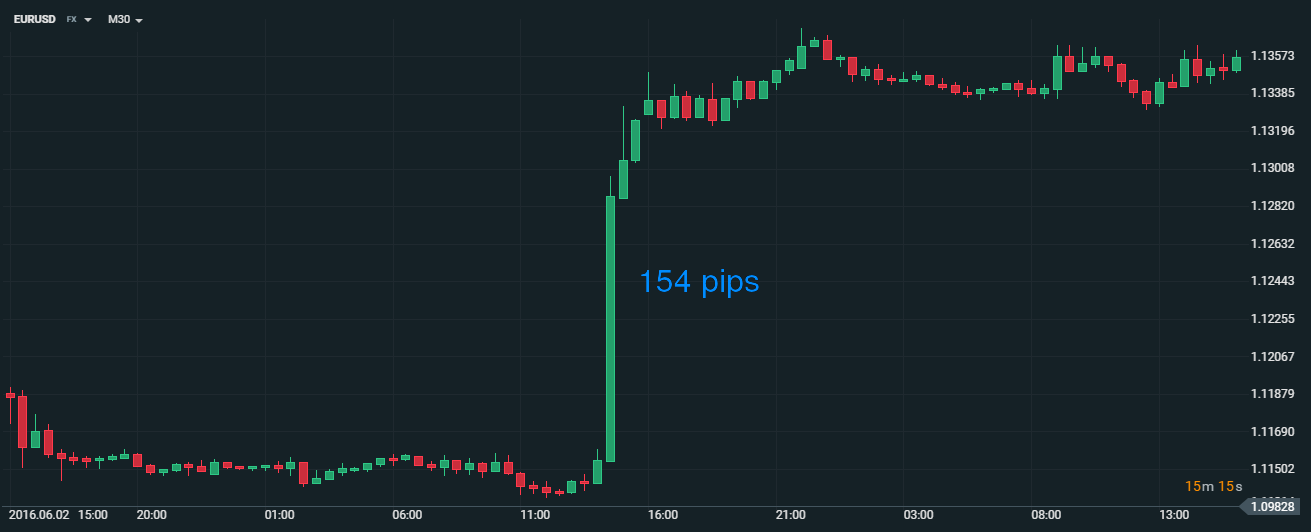
The chart above is a great example of both low and high volatility. This usually occurs before a significant macroeconomic reading, where traders are awaiting the outcome of the reading. After the reading is published, strong or significant movement can develop rapidly - as seen on the EURUSD chart above. This particular example occurred after the publication of the US non-farm payrolls, which came in vastly different to market expectations. It’s also interesting to note that once the initial reaction from the reading subsided, the market lost its volatility and returned to range-bound trading.
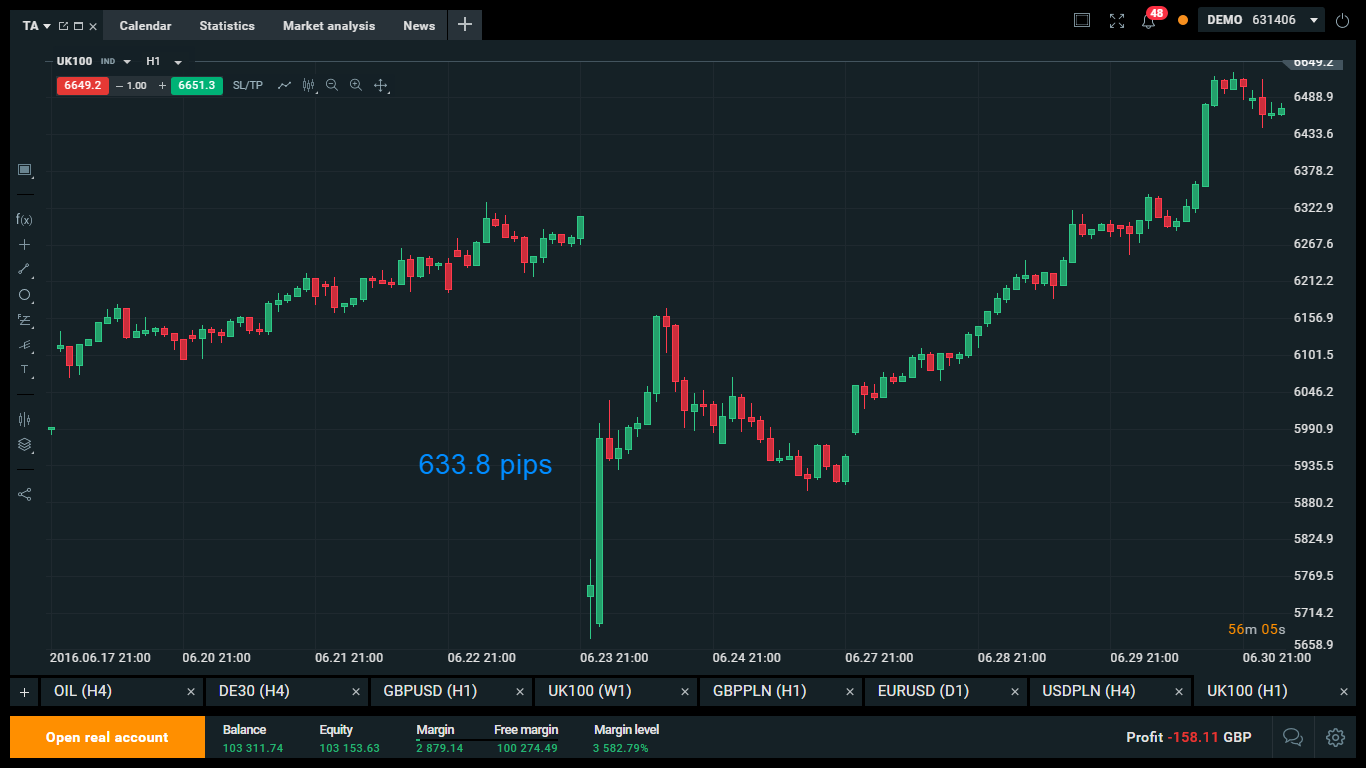
The example above shows the result of a UK referendum, where the UK100 chart fell by more than 600 pips in less than an hour. We can see a significant increase in risk aversion in the short term.
The Volatility Index (VIX)
The Volatility Index, known traditionally as the VIX, is a weighted index of implied volatility in options contracts on the US S&P 500 index. In effect, it’s a gauge of fear or pessimism in the market of 500 large capitalisation US stocks listed in the US, and as such a barometer of general market confidence and risk appetite.
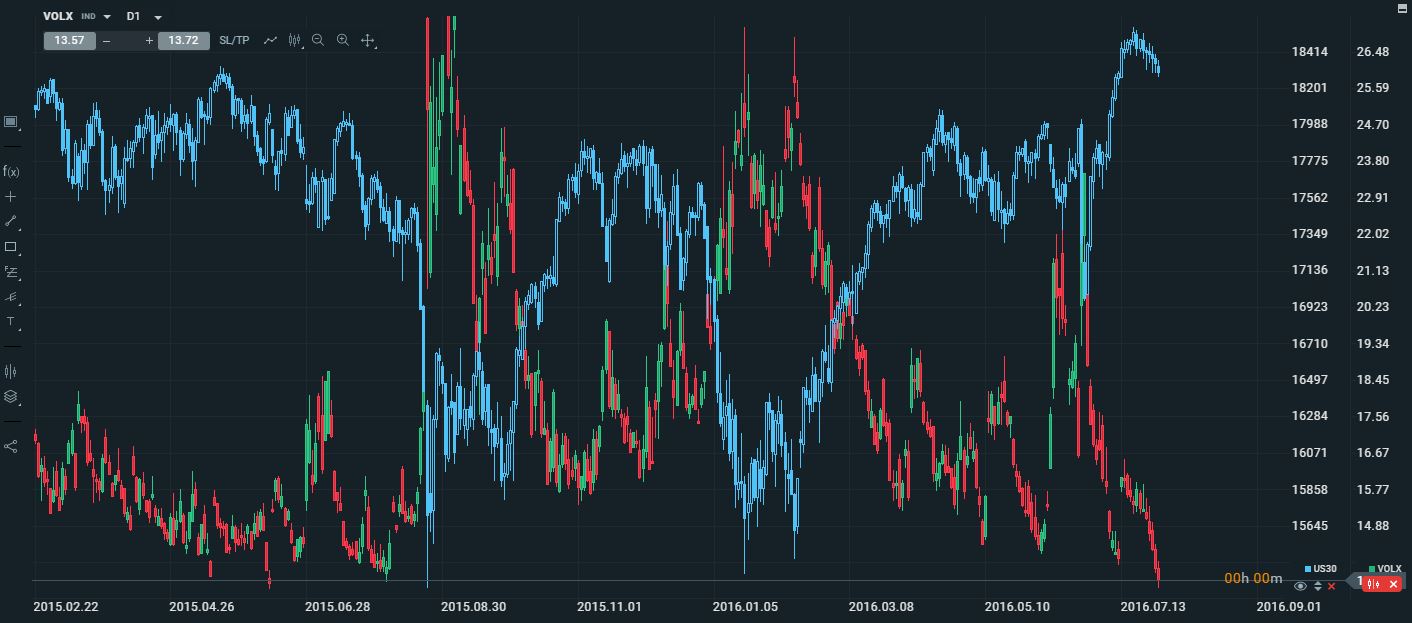
Historically, the VIX Index is inversely correlated with US stock markets. The lower the VIX has been, the more stable market confidence is and stocks have rallied. Equally, the higher the VIX has been, the more volatile the stock markets have been and suffered price falls.
The xStation chart below tracks the VIX index against the US30 (underlying Dow Jones Index) and it's here you can see the inverse correlation between the two indices strongly.
Key Takeaways
- Volatility refers to the amount of uncertainty, risk and fluctuations that occur on the market and, most often, to the amount of price changes over a given period on the financial markets.
- It’s a statistical measure of the dispersion of returns for any given instrument.
- There are two types of volatility: historical and expected.
- Traders tend to follow the Volatility Index (VIX), which can be considered to be a gauge of fear or pessimism in the marketplace.
FAQ
Volatility refers to the amount of uncertainty, risk and fluctuations that occur on the market and, most often, to the amount of price changes over a given period on the financial markets.
The speed or degree of the price change (in either direction) is called volatility. As volatility increases, the potential to make more money quickly, also increases. The tradeoff is that higher volatility also means higher risk and potentially higher losses. High volatility is often seen as a positive by more experienced traders.
High volatility is usually caused by economic or policy factors, including changes in other markets, interest rate hikes, and the Fed's current monetary policy. Political instability and other global events, like a pandemic or a war, can also lead to market volatility.
When a stock that normally trades in a 1% range of its price on a daily basis suddenly trades 2-3% of its price, it's considered to be experiencing “high volatility.”

Portfolio Diversification – How to diversify your trading portfolio?
Short Selling – What Is Short Trading?
Financial Years, Fiscal Quarters & Earnings Reports: What do they mean?
This content has been created by XTB S.A. This service is provided by XTB S.A., with its registered office in Warsaw, at Prosta 67, 00-838 Warsaw, Poland, entered in the register of entrepreneurs of the National Court Register (Krajowy Rejestr Sądowy) conducted by District Court for the Capital City of Warsaw, XII Commercial Division of the National Court Register under KRS number 0000217580, REGON number 015803782 and Tax Identification Number (NIP) 527-24-43-955, with the fully paid up share capital in the amount of PLN 5.869.181,75. XTB S.A. conducts brokerage activities on the basis of the license granted by Polish Securities and Exchange Commission on 8th November 2005 No. DDM-M-4021-57-1/2005 and is supervised by Polish Supervision Authority.