
Arista Networks (ANET.US) reported results that exceeded expectations, delivering the highest revenue growth in five quarters. Additionally, the company reiterated its forecasts for 2025. Despite this, in the initial market reaction, pre-market trading showed slight declines. Investors are concerned about the company's strong revenue concentration from Big Tech companies.
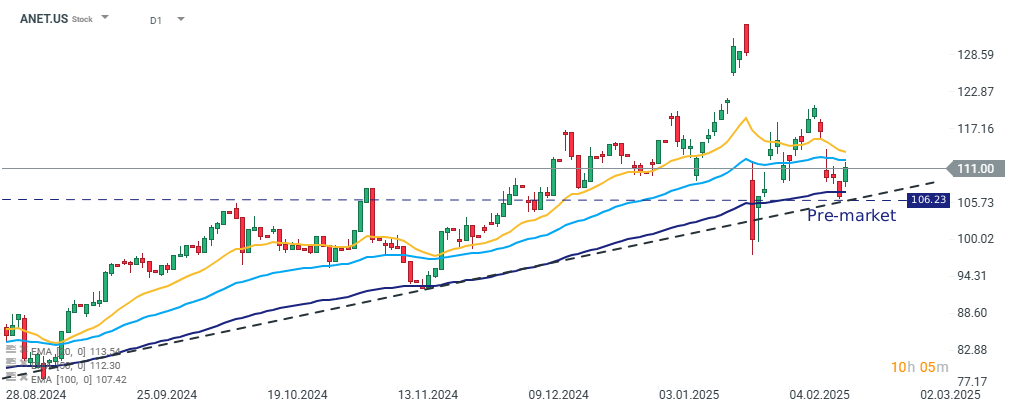
Pre-market trading stopped at a key support level defined by the lower boundary of the upward trend that has been in place since mid-2024. Source: xStation
The company exceeded market expectations in all key metrics. It reported revenues of $1.93 billion, representing a 25% year-over-year increase. Arista’s dynamic revenue growth began in 2022, but in the second half of 2023, the high base effect contributed to a slowdown in growth. As a result, the 4Q24 reading marks the highest revenue growth since 3Q23, and the company reached another record sales level.
At the same time, cost of revenue grew at a faster pace than revenue, causing a 1.3 percentage point decline in the operating margin compared to 4Q23. Despite this, the 47% margin remains 2 percentage points above expectations.
For 2025, the company reaffirmed its previous forecasts, expecting 17% revenue growth year-over-year, which would bring revenues to $8.2 billion. This projection seems somewhat conservative and has cast some doubt on Big Tech spending (particularly by Microsoft and Meta) on generative artificial intelligence development. Given Arista’s increasing revenue concentration in this segment, investors fear that a potential slowdown in spending by key players could threaten the company’s ability to sustain high growth rates.
4Q24 RESULTS
- Adjusted EPS: $0.65 (est. $0.57)
- Revenue: $1.93 billion (+25% y/y) (est. $1.9 billion)
- Product revenue: $1.61 billion (+23% y/y) (est. $1.6 billion)
- Service revenue: $322.3 million (+40% y/y) (est. $294.5 million)
- Cost of revenue: $699.4 million (+29% y/y) (est. $688.3 million)
- Product cost of revenue: $643.6 million (+30% y/y) (est. $633.7 million)
- Service cost of revenue: $55.8 million (+23% y/y) (est. $58.6 million)
- Adjusted operating margin: 47% vs. 48.3% a year earlier (est. 44.9%)
- Adjusted gross margin: 64.2% vs. 65.4% a year earlier

Is Another DeepSeek Moment Coming? Moonshot AI Increases Pressure on AI Giants

Daily Summary: A sell-off with a spin-off

US OPEN: The market extends losses as investor concerns grow

Market Wrap: European indices decline amid US - Iran tensions📉 Semiconductors under pressure