
Weekly change in fuel inventories:
-
Crude oil inventories: −1.27 million bbl
(forecast: −2.2 million bbl; previous: −1.81 million bbl) -
Gasoline inventories: +4.81 million bbl
(forecast: +2.1 million bbl; previous: +6.4 million bbl) -
Distillate inventories: +1.71 million bbl
(forecast: +2 million bbl; previous: +2.5 million bbl)
Why are these data important?
Weekly fuel-inventory changes are a key indicator for the energy market and investors because they reveal the balance between supply and demand. Rising gasoline and distillate inventories may indicate weaker consumer demand or oversupply, which can put downward pressure on refined-product prices. Meanwhile, a smaller-than-expected decline in crude inventories suggests the oil market is not as tight as anticipated, which could temper potential upside in crude prices.
Weekly changes in fuel inventories
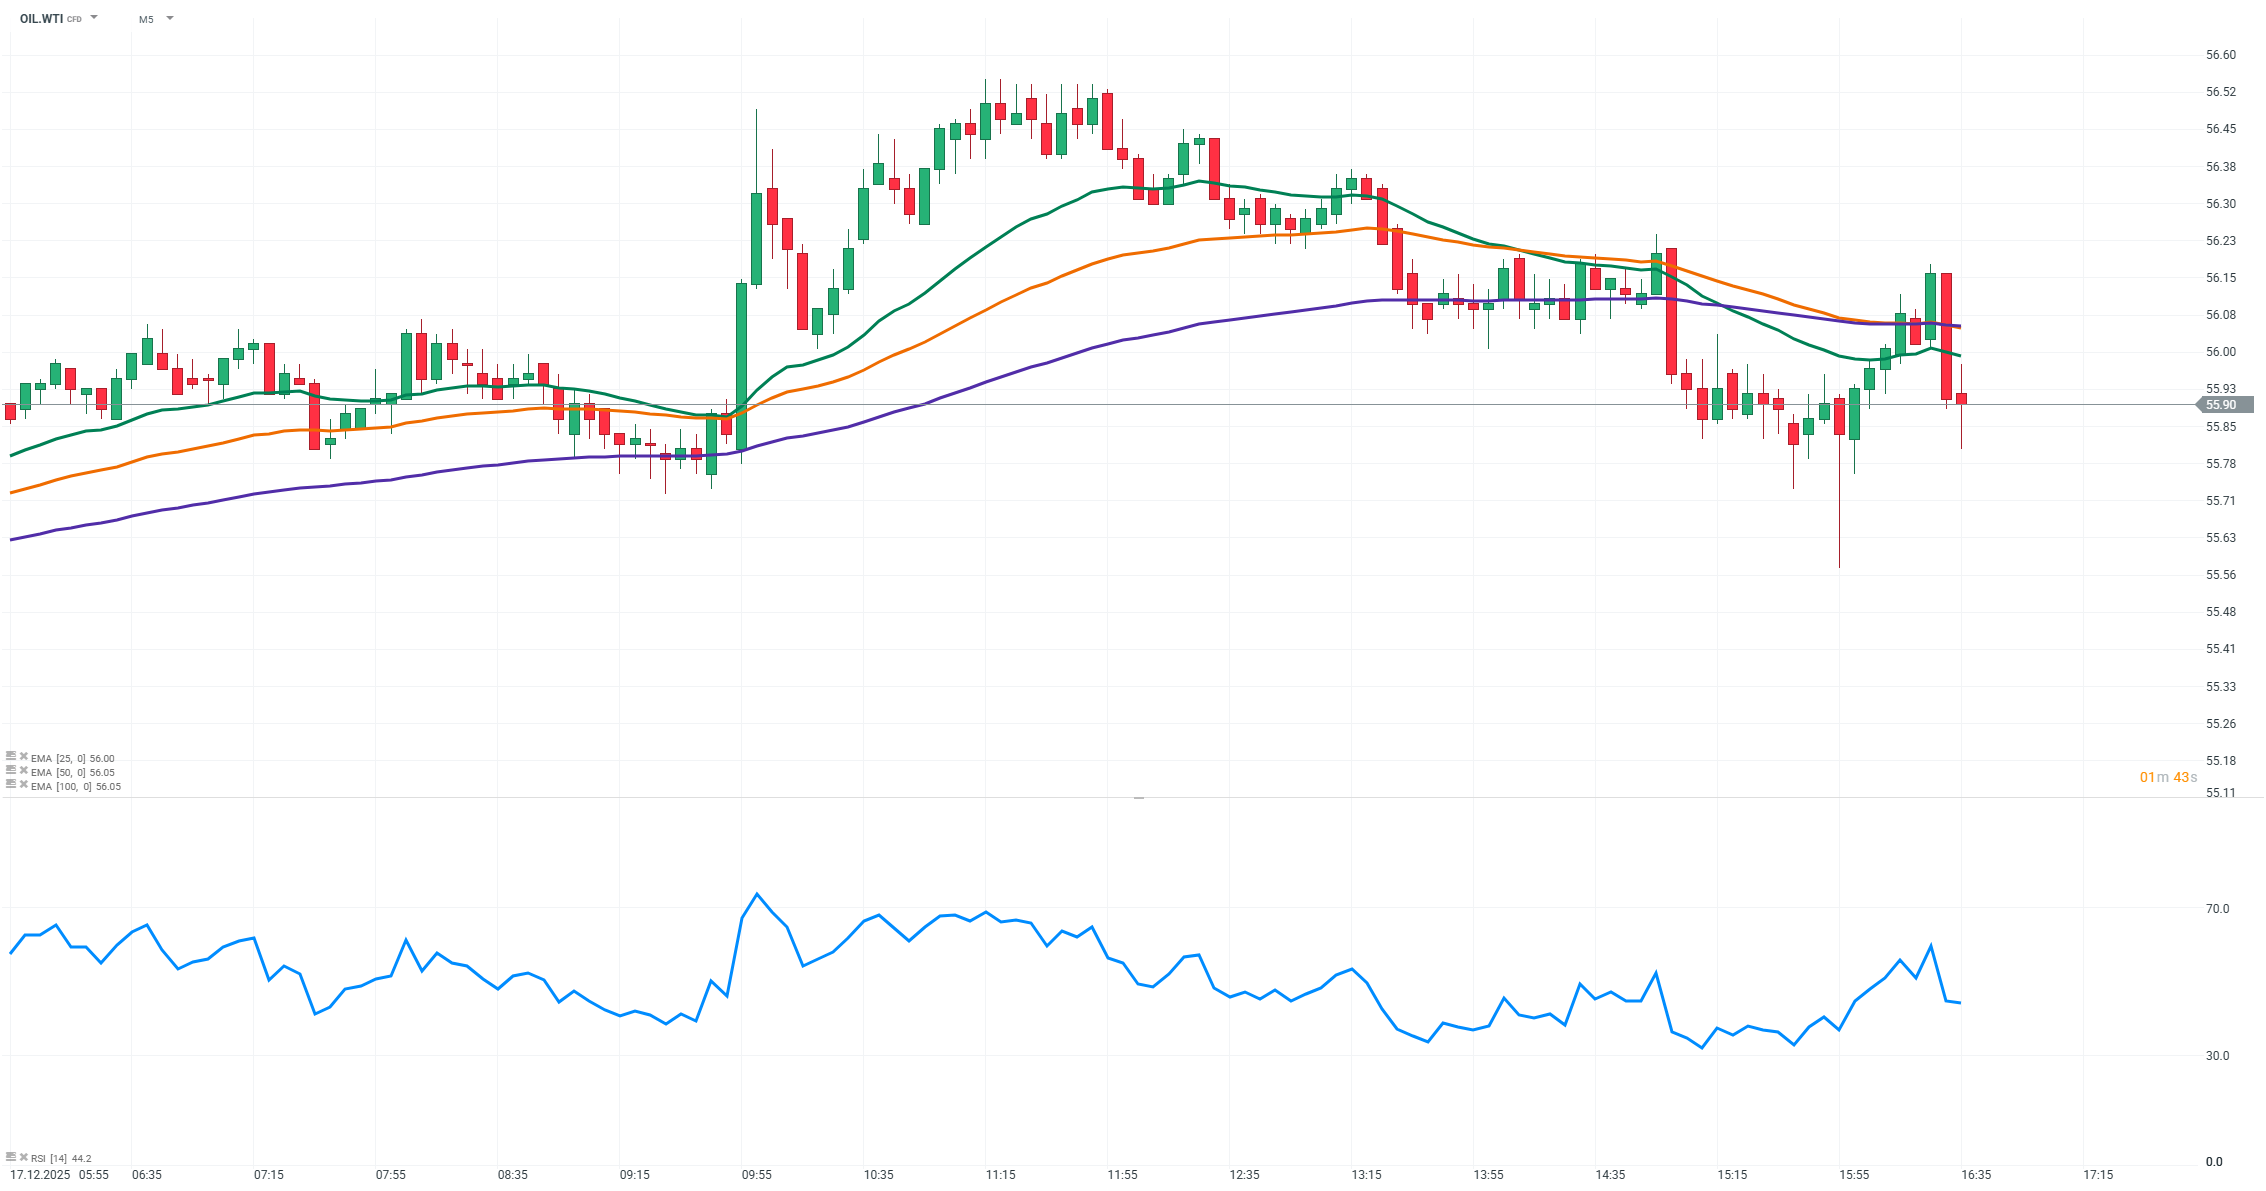
The data show a mixed picture for the fuel market. Crude-oil inventories fell by 1.27 million barrels, a smaller draw than expected (−2.2 million barrels) and less than the previous week’s decline (−1.81 million barrels). This may indicate weaker demand or higher supply of crude.
At the same time, inventories of refined products increased noticeably. Gasoline stocks rose by 4.81 million barrels — significantly above the forecast (+2.1 million barrels), although less than the previous week’s surge (+6.4 million barrels). Distillate inventories increased by 1.71 million barrels, also below expectations (+2 million barrels) and below last week’s reading (+2.5 million barrels).
Overall, the data point to continued supply-side pressure in the fuel market, especially in the gasoline segment, alongside a moderate crude-inventory drawdown. This combination may limit the near-term upside potential for crude-oil prices.

Cocoa loses 5% amid rising inventories on ICE

Oil gains 3% amid US - Iran escalation and supply disruption on the Black Sea

🔼 Gold gains 1.7%

🛢️Brent Crude Oil Tests $95 per Barrel