
US PCE price index y/y: 4,2% vs 4,1% exp. and 5,0% previously
US PCE price index m/m: 0,1% vs 0,1% exp and 0,3% previously
US Core PCE y/y: 4,6% vs 4,58% exp and 4,6% previously
US Core PCE m/m: 0,3% vs 0,3% exp and 0,3% previously
US Consumer spending data: 0% vs -0,1% exp and 0,2% previously
The data are mostly hawkish, because Fed may read it as higher inflation regime warning. The PCE measure is key for Federal Reserve policmakers. Americans income is higher but consumption is slower indicating that inflation put some pressure on US households.
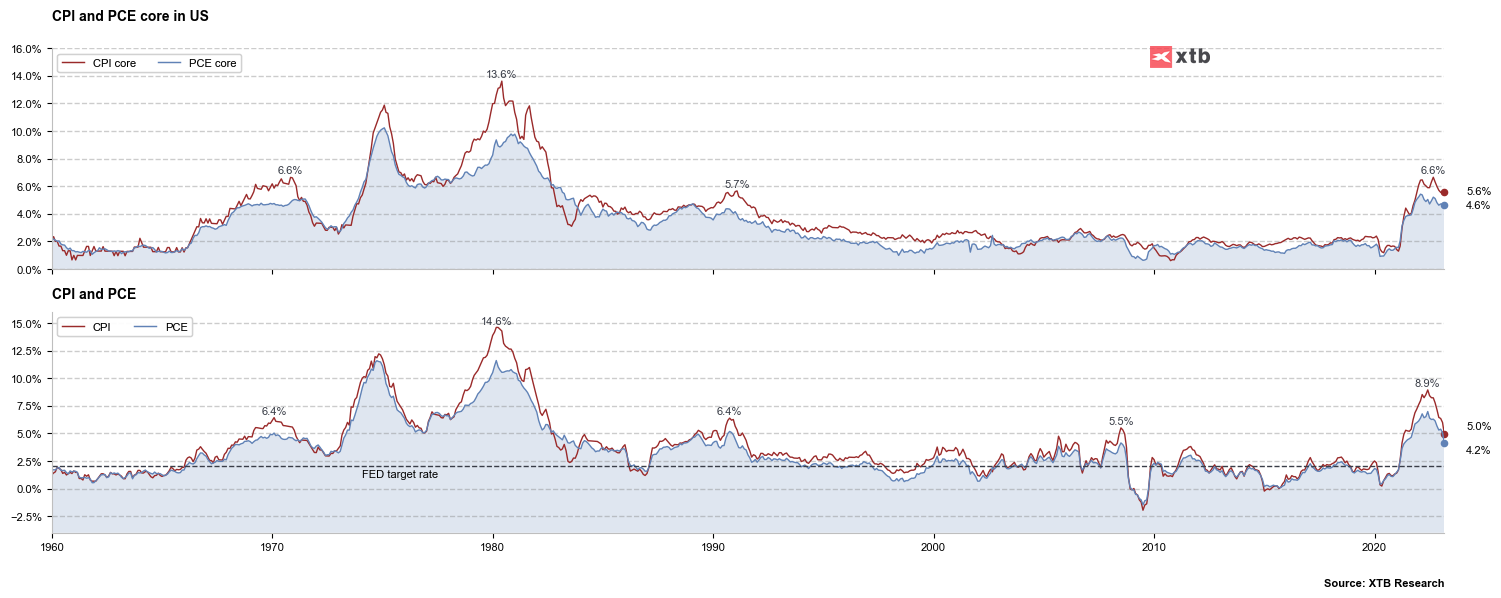 Core PCE inflation is falling slower than the analyst consensus expected. The overall trend against CPI readings is of course still pointed downward. However, the loss of downfall momentum may herald that price pressures are becoming entrenched at levels that are too high. In that case, the Fed would have a much more difficult job to do. Source: XTB
 The first reaction of US100 on PCE data is mixed. Source: xStation5

BREAKING: Eurozone recovery? Positive PMI data tempered by high oil and gas prices

Economic Calendar: Big Tech, Tensions Over Iran, and the ECB’s Decision ⏰

Daily Summary: Wall Street Stabilizes Despite Higher Oil Prices

Economic Calendar: Time for Tesla and Google Earnings (22.07.2026)