
Corn has experienced the biggest sell-off in 17 months last Friday. Interestingly, it is hard to point a factor that could have triggered such a decline. Moreover, the latest agricultural exports data from the United States has been very good. On the other hand, forecasts for South America will be raised. Additionally, the number of long positions on corn and soybean has been greatly reduced as of late. It is worth noting that the number of open long positions has been extremely high lately, the highest in a dozen or so years. Corn is trading 1.3% lower today but closing of the monthly candlestick is crucial now. Price dropped below 38.2% retracement and 500 cents area. Should we see a drop below 480 cents area, the bearish scenario may start to materialize.
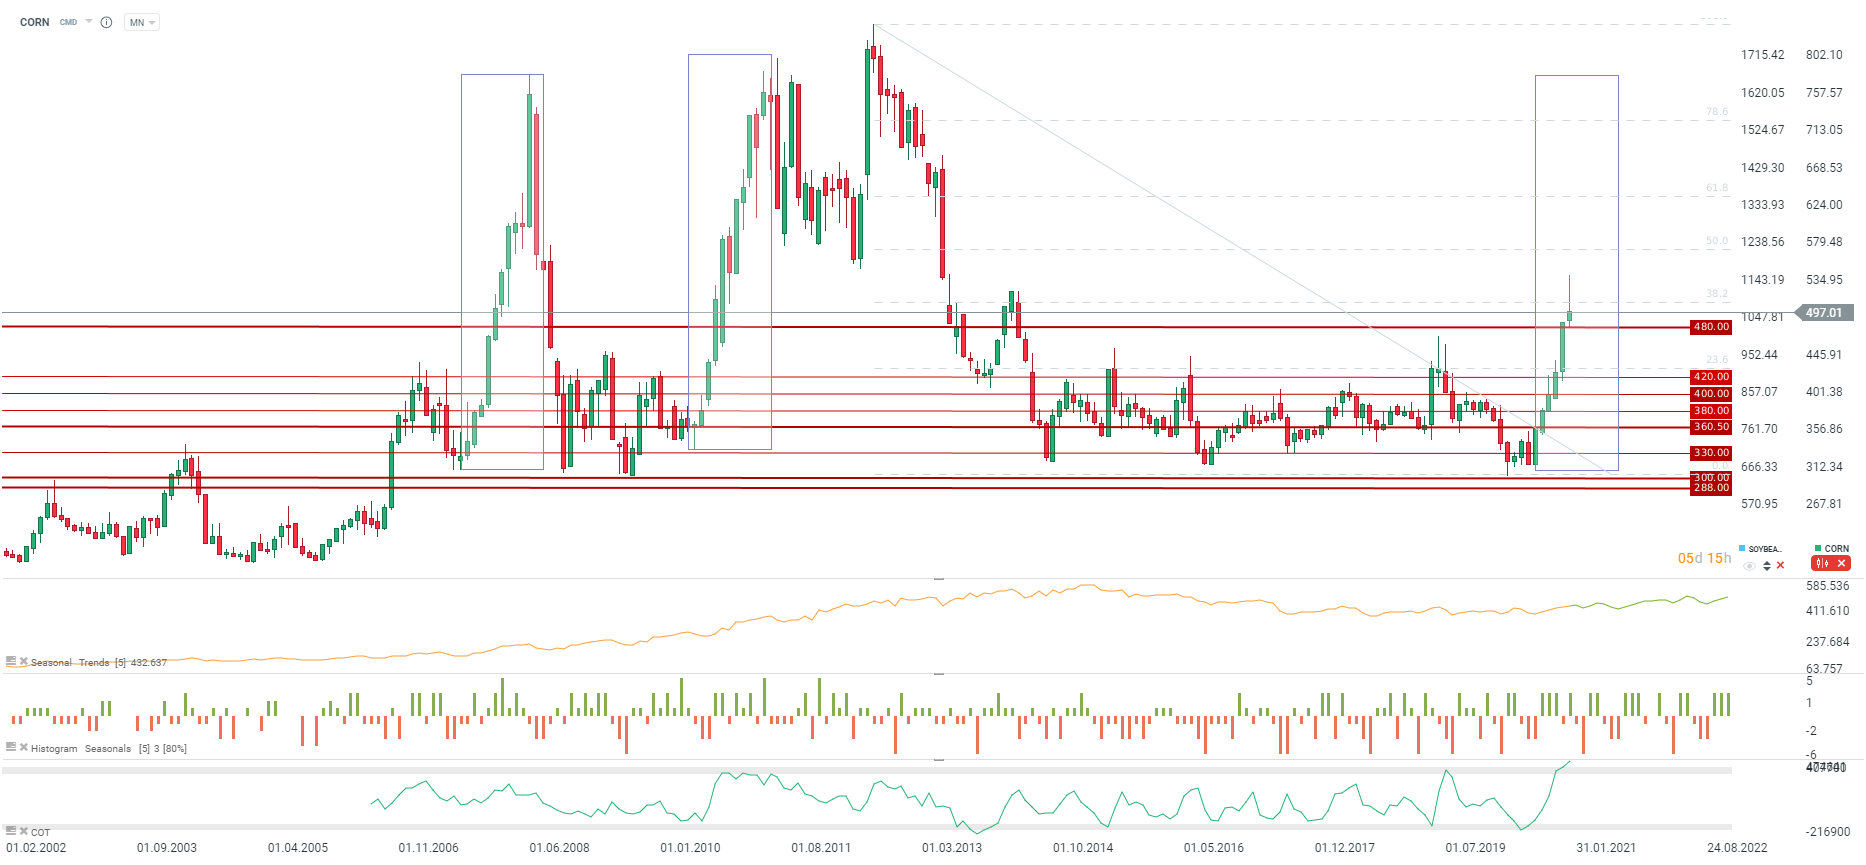
Closing of the monthly candlestick will be crucial for corn. Drop below 480 cents could invalidate a bullish case even in spite of solid fundamentals. There is a strong seasonal pattern of declines in February. On the other hand, long-term seasonality (15-year) points to a local high being reached in May and local low in July/August. Source: xStation5

Daily Summary: Wall Street Regains Ground; Another Intervention in the Yen Market❓

Three Markets to Watch Next Week (July 31, 2026)

Market Wrap: European equities at 3-week highs! Apple dips in US premarket!

Economic Calendar: Key European CPI Readings and Oil Giants’ Earnings