
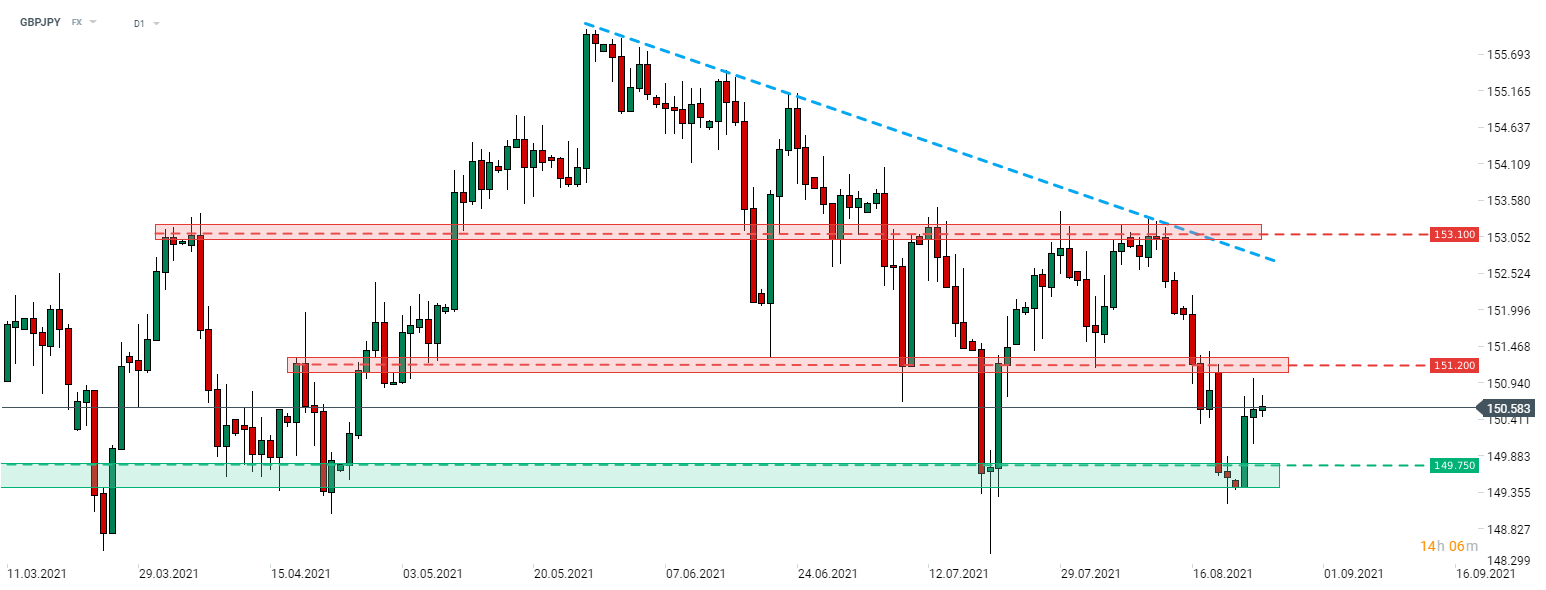
GBPJPY traded in a downward move since late-May 2021. However, the downward move was stopped at the 149.75 support zone at the end of the previous week. This was the second time this zone halted decline and ongoing strong rebound suggested that a move towards the downward trendline may be looming. The near-term resistance to watch can be found at 151.20 and is marked with previous price reactions. Breaking above would pave the way towards the aforementioned trendline that currently runs in the 152.70 area. Note that in order to invalidate the downtrend structure a break above the local highs at 153.10 would be required.
 Source: xStation5

Daily Summary: Equities Diverge as Tech Lags, Europe Rallies on Earnings & PMIs (24.07.2026)

Three markets to watch next week (24.07.2026)

BREAKING: Eurozone recovery? Positive PMI data tempered by high oil and gas prices

Economic Calendar: Industry’s condition in the shadow of oil prices