
Japanese stock market index - Nikkei 225 (JAP225) - was the worst performing major index during today's Asian session. Nikkei finished today's cash trading 3.08% lower, marking the worst single day plunge since the end of February. Drop was a reaction to a strong sell-off of the US tech shares yesterday.
Taking a look at JAP225 from a technical point of view, we can see that the index has been trading in a narrowing wedge pattern since the beginning of February 2021. Following today's decline, the index has moved from the vicinity of the upper limit of the pattern towards the lower limit of the pattern at 28,500 pts. Note that the price zone ranging around 28,500 pts has halted downward move in recent months. When it comes to near-term outlook for the index, it will depend on the direction of a break from the pattern. In theory, breaking above the upper limit should herald a large upward move while a break below the lower limit could be a signal that deeper decline is coming.
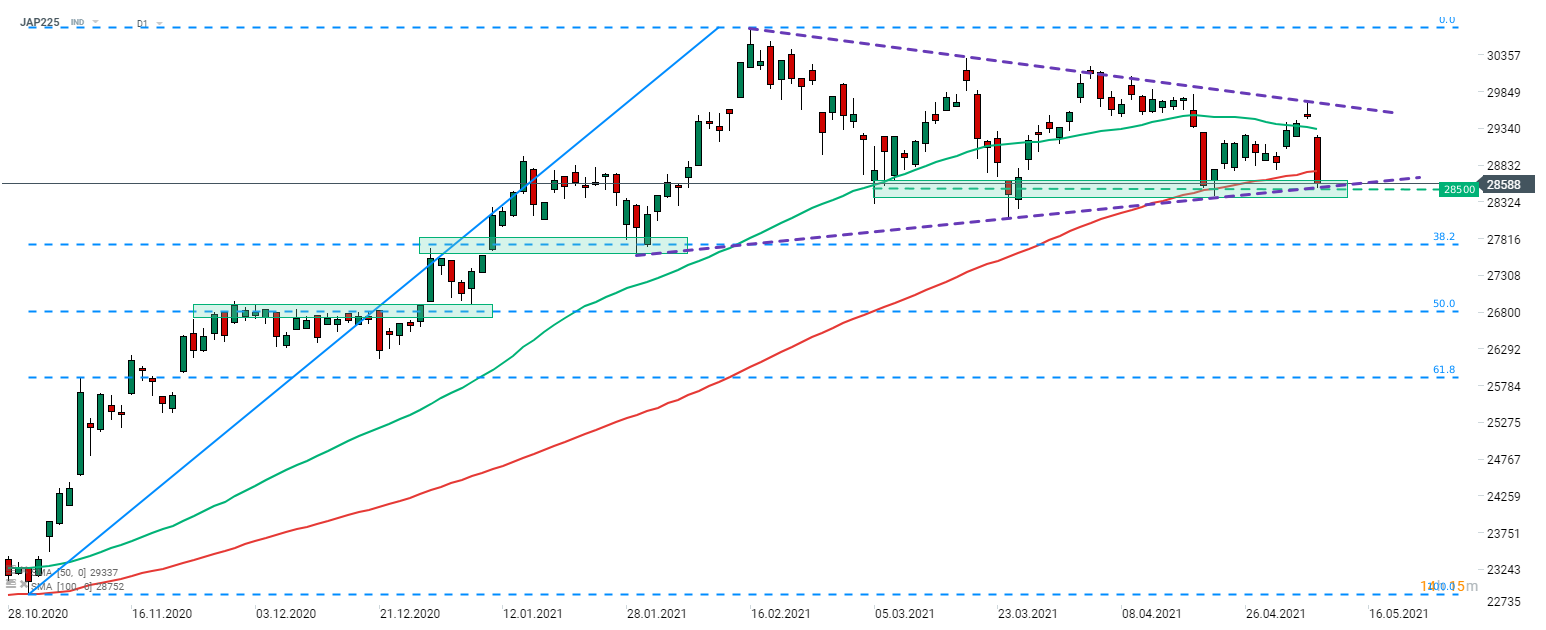 Source: xStation5

Daily Summary: Wall Street Regains Ground; Another Intervention in the Yen Market❓

Three Markets to Watch Next Week (July 31, 2026)

Market Wrap: European equities at 3-week highs! Apple dips in US premarket!

Economic Calendar: Key European CPI Readings and Oil Giants’ Earnings