
Oil prices took a hit in the late evening yesterday on news that Iranian nuclear deal is just days away. The United States, China and France were positive that a deal can be reached soon and said that now it all depends on Iran. Return of Iranian crude to the global markets could significantly boost global oil supply. Oil prices plunged around 5% over the course of 5 hours in response to those news. However, the situation took a U-turn this morning with news of clashes in the eastern part of Ukraine. As the situation is getting more tense, concerns over security of Russian oil supplies and exports grow. Majority of yesterday's losses were recovered already and WTI has once again reached the $91 per barrel area.
Taking a look at the WTI chart (OIL.WTI) at the H4 interval, we can see that yesterday's drop was halted at an important support zone. The zone ranging near the $88.88 handle is marked with previous price reaction as well as the lower limit of a local market geometry. According to Overbalance methodology, as long as the price sits above $88.88, the main trend remains upward. Situation on Ukraine should be watched closely by oil traders and is likely to have a bigger short-term impact on prices than reaching of the Iranian nuclear deal.
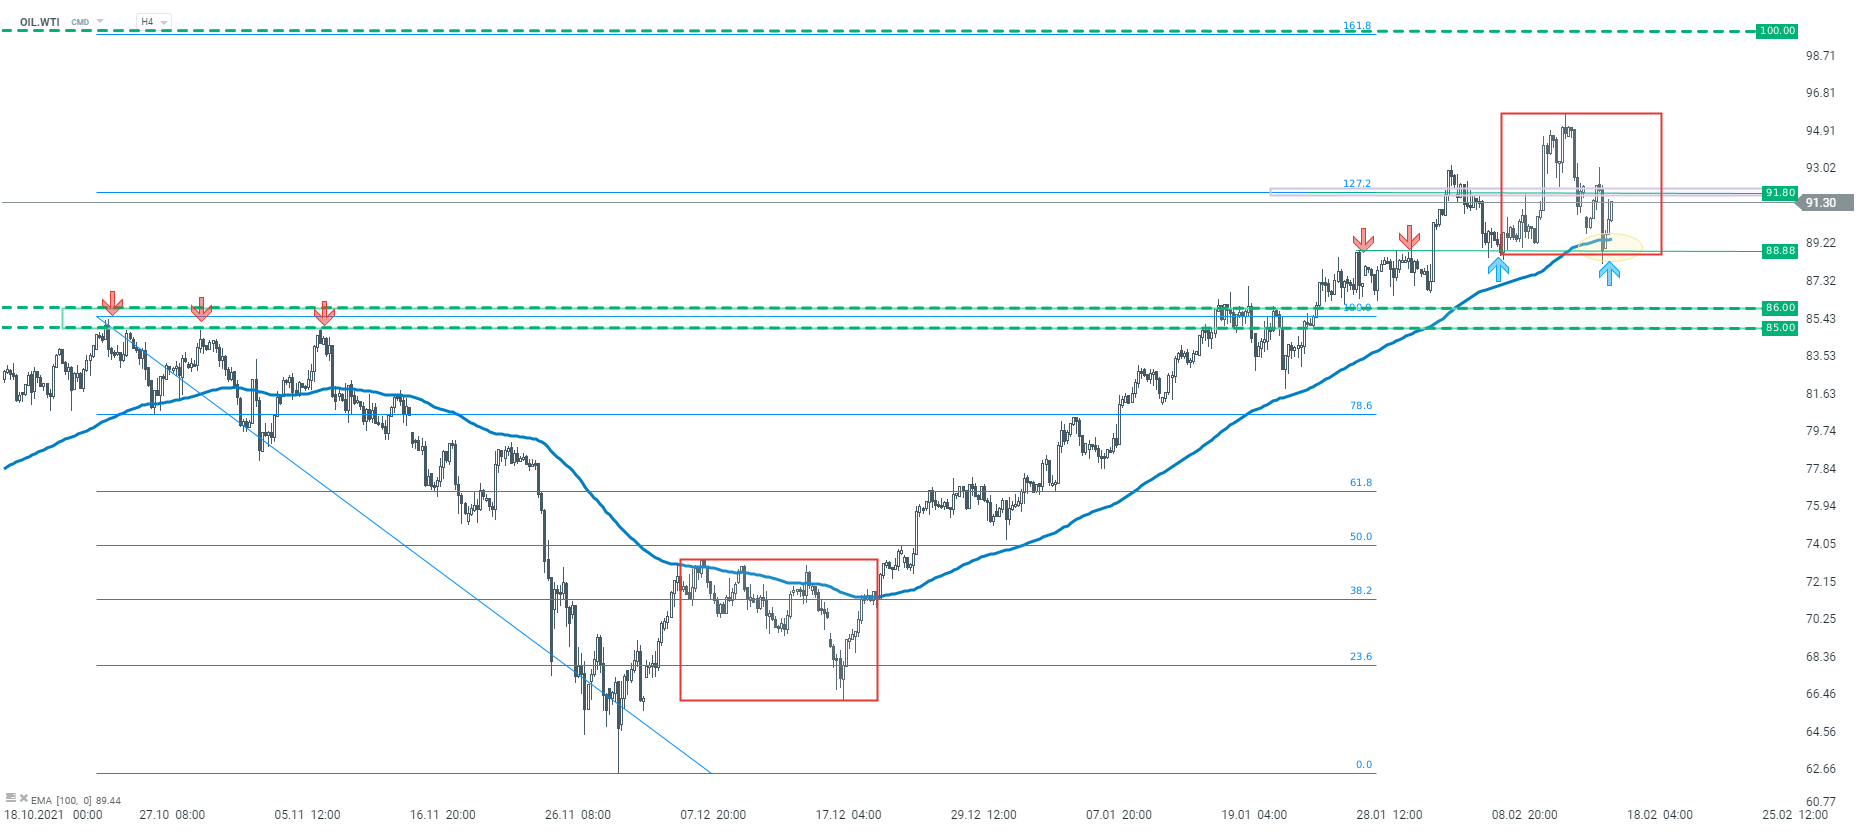 Source: xStation5

Morning Wrap: Asia dips on SK Hynix earnings and Iranian attacks! Dollar stalls before Fed (29.07.2026)

The coffee market in the grip of weather and empty warehouses: The paradox of record Brazil harvests

Chart of the Day: Who suffers from the oil price drop? (28.07.2026)

Economic Calendar: PayPal, Visa and Coca-Cola to overshadow macro data (28.07.2026)