
After yesterday's successful report of falling CPI and core inflation in the US, today it will be the turn of data readings prepared by the University of Michigan. In addition to consumer sentiment, we will learn, among other things, about inflation expectations, which, as we know, are a kind of 'self-fulfilling prophecy' and reflect somewhat the 'temperature' of sentiment in the economy. The trend of declining inflation expectations may be just as much a signpost for future inflation readings and the economic slowdown resulting from weakening demand.
Inflation expectations according to the University of Michigan (16:00)
Inflation expectations at one-year horizon: Expected: 5.1% y/y. Previously: 5.0% y/y
Inflation expectations at a 5-year horizon: Expected: 2.9% y/y. Previously: 2.9% y/y
A larger-than-expected drop in inflation expectations could strengthen bullish positions in anticipation of a Fed pivot and a cooling of the Federal Reserve's aggressive, hawkish sentiment. Indeed, the Fed is likely to lean toward lower hikes at future meetings. In such a situation, the base scenario seems to be a weakening of the dollar and a strengthening of indices and precious metals, where capital hitherto 'waiting for opportunities' in the perceived safe haven US dollar may flow in. Looking at the SILVER chart on the D1 interval, we can see that the price of silver has gained dynamically in the last few days, bouncing nearly 20% from annual lows near $18. Key support can be found in the area of $17.5 per ounce. This support is set by previous price reactions. Demand reacted three times to dips in the area of $18 and each time stopped the bullion price from falling deeper, forming a bullish formation resembling a triple bottom. Significantly, the SILVER price broke through resistance in the form of the 200-session moving average (red), which indicates a possible change in trend. Note that the 50-period moving average (black) is starting to wrap upwards towards the 200-period average. If the upward momentum is received, and the averages intersect - we can expect a so-called "golden cross" on the SILVER chart, which can be perceived as a kind of 'confirmation' of the trend change.
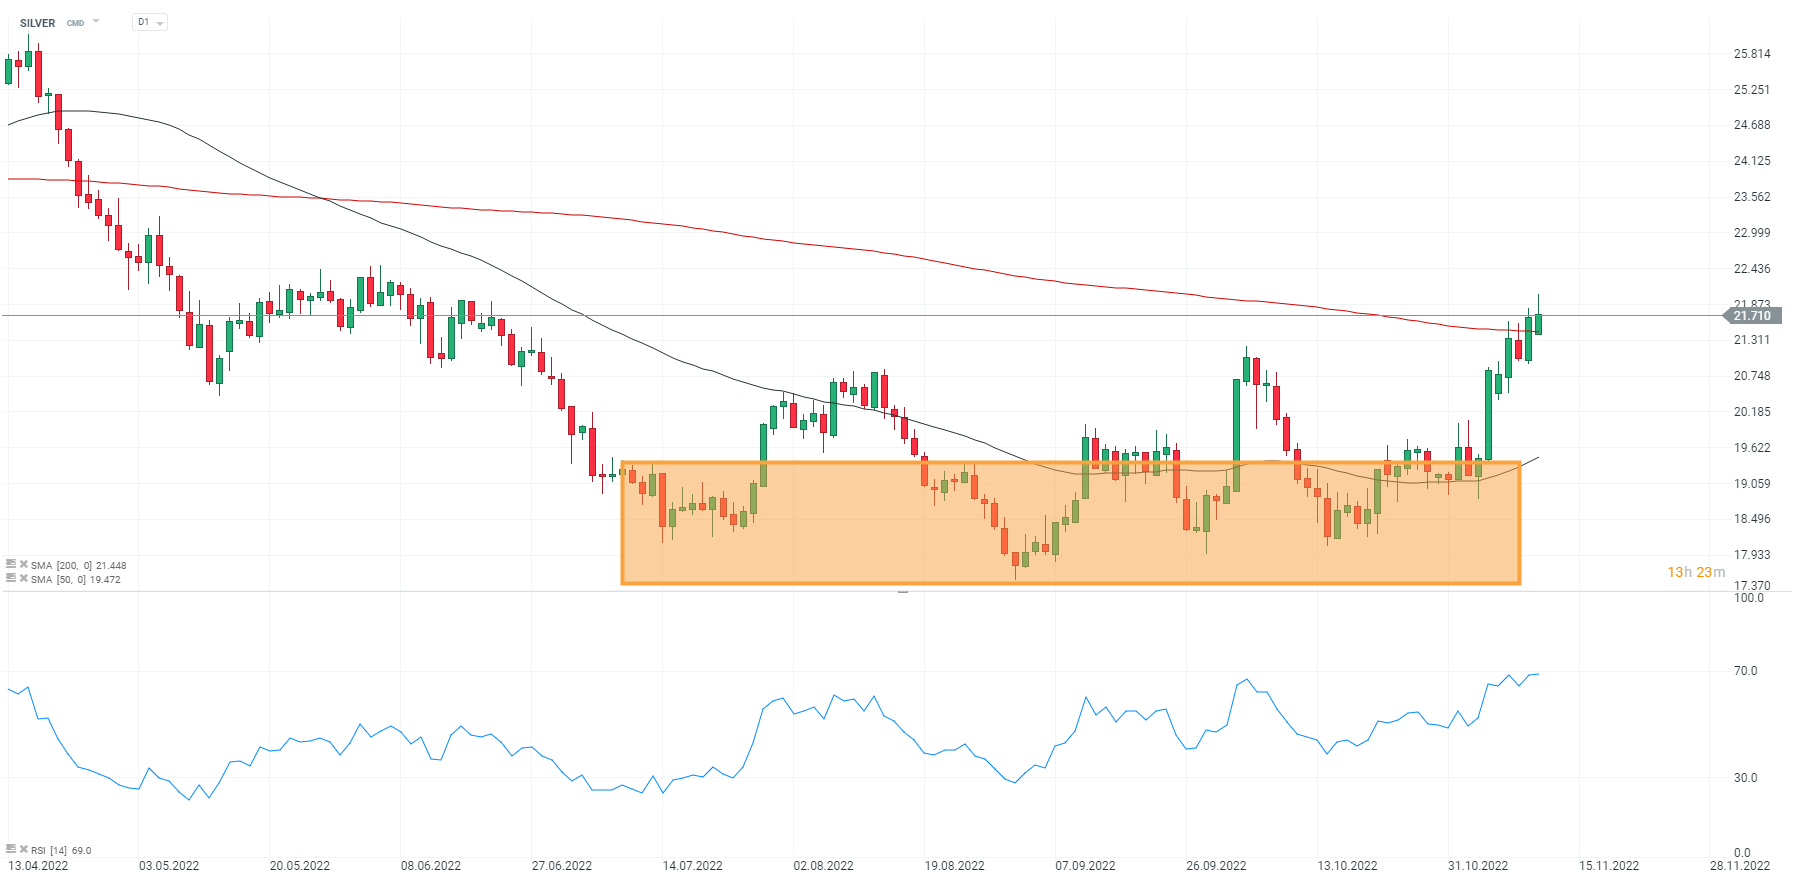 Source: xStation5

Economic calendar - Europe's Inflation and US Housing Market in Spotlight

Economic Calendar: Earnings, US Retail Sales and Fed to Fight for Investors' Attention (16.07.2026)
BREAKING: GBPUSD up 0.1% after better-than-expected UK GDP data 🇬🇧 📈

Daily Summary: Wall Street Gains, Dow Jones Near All-Time Highs After Softer PPI Data