


Silver gained around 1% yesterday. However, precious metal began to pull back during the Asian session and a classic reversal pattern may be building up on the chart. Taking a look at SILVER at H1 interval, we can see that price may have painted the right shoulder of head and shoulders pattern. Key support, marked with the neckline of the pattern, can be found at $27,10. This area is additionally strengthened by previous price reactions. Should SILVER break below this hurdle, downward move may accelerate. The nearest resistance to watch can be found at $27.65 - breaking above this level will invalidate the aforementioned head and shoulder setup.
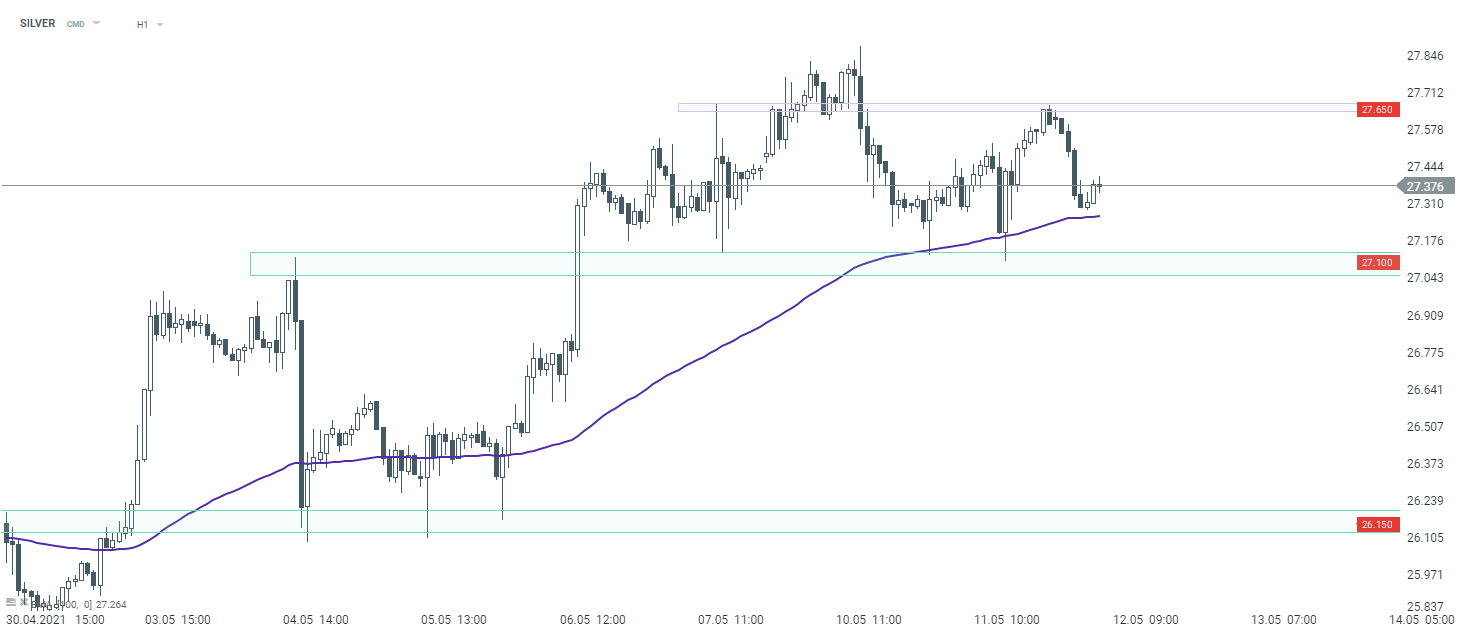 Source: xStation5


Daily Summary: SpaceX and the tech sector drive Wall Street, oil retreats sharply below $97


📉NATGAS loses 6% ahead of rollover


Russia is selling off gold reserves. Why, to whom, and does it matter for the market?

BREAKING: US oil inventories fall more than expected, but distillate build cools enthusiasm